
- Title
-
Highly-restricted, cell-specific expression of the simian CMV-IE promoter in transgenic zebrafish with age and after heat shock
- Authors
- Suhr, S.T., Ramachandran, R., Fuller, C.L., Veldman, M.B., Byrd, C.A., and Goldman, D.
- Source
- Full text @ Gene Expr. Patterns
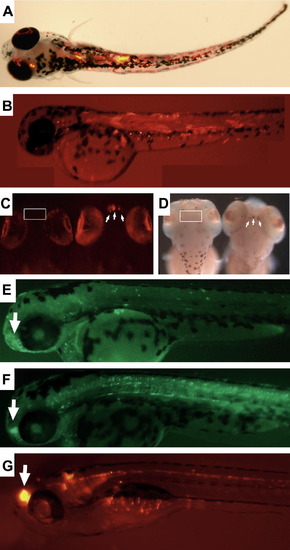
(A) Representative pattern of sCMV promoter-driven dsRed expression in a zebrafish embryo 3–4 days following injection of eggs revealing scattered cells throughout the embryo. Top view with brightfield overlay. (B) As in (A), side-view fluorescent image. (C) Top view of the head of control (left and transgenic (right) embryos displaying early dsRed fluorescence in a small population of cells within the rostral telencephalon (arrows indicate cell, boxed region on control shows no positive signal). (D) The same fish as in (C), processed for in situ hybridization and showing reporter mRNA expression in the transgenic fish (right) and a corresponding lack of signal in control siblings (left). Note: oval light-brown patches on both animals are pigment spots and not positive hybridization. (E) Early (2.5 dpf) EGFP expression in rostral telencephalon and other scattered cells in the head, trunk, and spinal cord area of line sCMV:EGFP-1 fish. (F) As in (E), for line sCMV:EGFP-2 that displayed higher expression in spinal cord by 2.5 dpf. (G) Ventral view of the sCMV expression pattern in a 2-week-old sCMV:dsRed 2-1 F1 transgenic fish that represents the general expression pattern observed in young sCMV-transgenic fish. Stable transgenic animals after 7 dpf express most notably in the rostral telencephalon, within the eyes, and in discrete cells of the brain stem and spinal cord. EXPRESSION / LABELING:
|
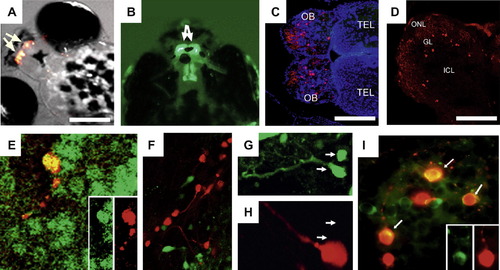
(A) dsRed fluorescence overlayed with a brightfield image of a 7 dpf fish reveal the brightly fluorescent cell population in the olfactory bulb (OB) (arrows). (B) The OB cell population in a fish from line sCMV:GFP-2 at 1 month post-fertilization. (C) Horizontal section of the adult transgenic sCMV:dsRed 2-1 fish rostral telencephalon (TEL) and OB stained with the nuclear stain DAPI (blue) and showing fluorescent cell bodies and fibers in the OB (anterior left). (D) Horizontal section of the adult OB revealing dsRed cell bodies predominantly in the glomerular layer (GL) and superficial internal cell layer (ICL) with arbors extending into the olfactory nerve layer (ONL). (E) Consistent with their neuronal morphology, dsRed-positive OB neurons colocalize with HuC/D immunoreactivity (yellow). Insets show individual green (HuC/D) and red (dsRed) channels. (F) Retrograde labeling of olfactory bulb mitral cells (green) reveals dsRed-expressing cells are not mitral cells. (G and H) Higher magnification image shows separate green (G) and red (H) channels. Arrows indicate the position of green-labeled mitral cells in both images. (I) Antibody to tyrosine hydroxylase (green) colocalizes with a subset of dsRed-positive cells (arrows). Insets show individual channels for one double-labeled neuron. All images are of sCMV:dsRed line 2-1. Scale bars: A/B = 250 μm; C = 150 μm; D = 75 μm. |
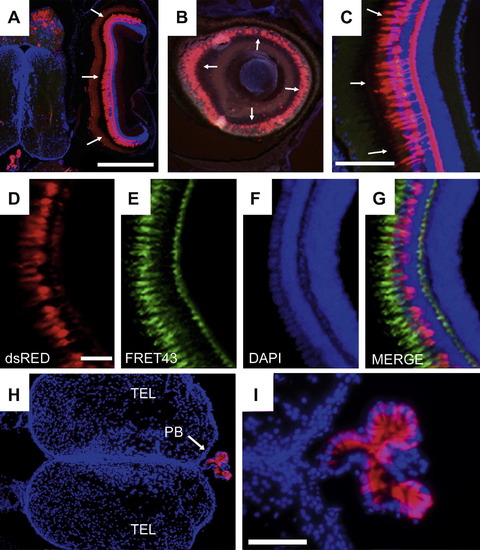
(A) Horizontal section through the head of an adult transgenic fish showing the brain and adjacent eye with strong dsRed-expressing cells apparent in the retina (arrows). Blue is DAPI stain and anterior is up. (B) Fluorescent cells appear as a ring (indicated by arrows) in para-sagittal sections of retina. (C) Cross-section of DAPI-stained retina revealing that fluorescent cells have the position and morphology of photoreceptors. (D–G) Cellular analysis of reporter-expressing cells in the adult fish retina showing dsRed fluorescence (D), FRET43 immunolabeling (E), DAPI (F), and a merge of all three channels in (G). (H and I) Low-(H) and high-(I) magnification images of dsRed-positive cells (red) and DAPI staining (blue) in horizontal sections of an adult transgenic fish brain showing the pineal body. In (H and I), anterior is to the left. Scale bars: A/B = 500 μm; C = 125 μm; D–G = 50 μm; H = 250 μm; I = 100 μm. All images are of line sCMV:dsRed 2-1. EXPRESSION / LABELING:
|
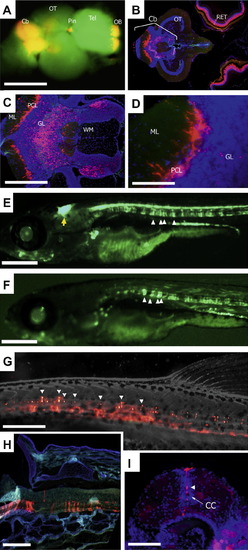
(A) Fluorescent image of explanted whole brain from a sCMV:dsRed transgenic fish crossed with a α1-tubulin:GFP transgenic fish (sCMV:dsRed 2-1 x α1T:EGFP-2) highlighting dsRed expression in the brain regions described in the text. Cerebellum (Cb), optic tectum (OT), pineal body (Pin), telencephalon (Tel), and olfactory bulb (OB). Anterior is to the right in (A–D). (B) Horizontal section through the CNS of an adult sCMV:dsRed transgenic fish imaged at low magnification showing strong dsRed expression in multiple cells and fibers of the cerebellum. (C) Higher magnification of the cerebellum and surrounding area with red reporter expression. ML, molecular layer; PCL, Purkinje cell layer; GL, glomerular layer; WM, white matter tracts. (D) Close-up of the PCL reveals strongly dsRed expressing cells with large cell bodies and extensive arbors and smaller positive cells in the GL. (E) Fluorescent image of the pattern of EGFP expression in a sCMV:EGFP-1 fish at 1 mpf. High-level expression is observed in the cerebellum (yellow arrow) and multiple cells of the spinal cord (white arrows) at this age. (F) As in (E), for line sCMV:EGFP-2. (G) Magnified image of fluorescent cells in the spinal cord of an sCMV:dsRed 2-1 fish (darkfield image overlaid). Red autofluorescence below the midline was obscured to permit better visualization of faint cells in the spinal cord. (H and I) dsRed-expressing cells in the spinal cord in sagittal (H, rostral is left) and cross-sections (I) of the sCMV:dsRed adult fish. Non-red color in (H) is autofluorescence imaged to provide orientation, and blue fluorescence in (I) is DAPI nuclear stain. Arrowhead indicates the cell body of one of the strongly positive cells adjacent to the central canal (CC). Scale bars: A/B = 1 mm, C = 250 μm; D = 100 μm, E/F = 0.7 mm; G = 0.5 mm; H = 250 μm; I = 100 μm. EXPRESSION / LABELING:
|
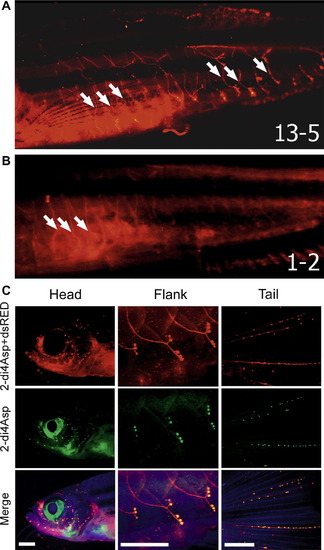
(A) Fluorescent image of the flank of a sCMV:dsRed line 13-5 fish at 5 months showing expression in the anterior and posterior lateral line nerves (white arrows). (B) Flank of a sCMV:dsRed line 1-2 fish age matched to the fish in (A) to show variation in the intensity of expression in the lateral line and appendicular muscle. (C) The lateral line system in a 2-month old sCMV:dsRed line 13-5 fish in three areas: head, trunk (flank), and tail. Lateral line fibers are shown with dsRed expression (red), the lateral line neuromast dye DASPEI (red/green in neuromasts only), and autofluorescence (blue – included to facilitate orientation). DASPEI stained hair cells of the neuromasts appear as bright dots in the green channel. Faint green fluorescence in the fibers proximal to neuromasts in the 2Di4Asp panels is due to low levels of DASPEI back-labeling. Scale bars = 1 mm (anterior left in all images). EXPRESSION / LABELING:
|
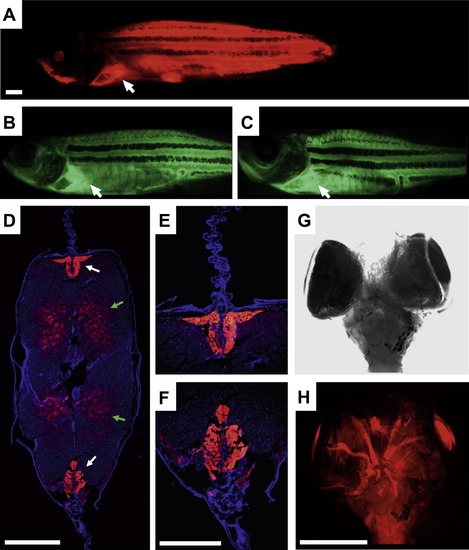
(A) Whole body fluorescent image of a sCMV:dsRed fish (line 2-1) at 5 months showing expression in the skeletal muscle and high-intensity fluorescence in areas proximal to fins such as pectoral fin muscles indicated by an arrow. (B and C) Like (A), for lines sCMV:EGFP-1 and 2, respectively. (D) Cross-section of the adult sCMV:dsRed 2-1 fish trunk revealing lower transgene expression in general trunk muscle (green arrows) and a much higher level of expression in appendicular muscle such as muscles for dorsal (upper white arrow) and anal fins (lower white arrow). (E and F) Higher magnification of expression in muscles driving the dorsal and anal fins, respectively. (G and H) Brightfield and fluorescent images (respectively) of explanted eyes and brain viewed from the ventral side showing dsRed-positive appendicular muscle controlling eye movement. Scale bars = 1 mm except E/F = 0.5 mm. EXPRESSION / LABELING:
|
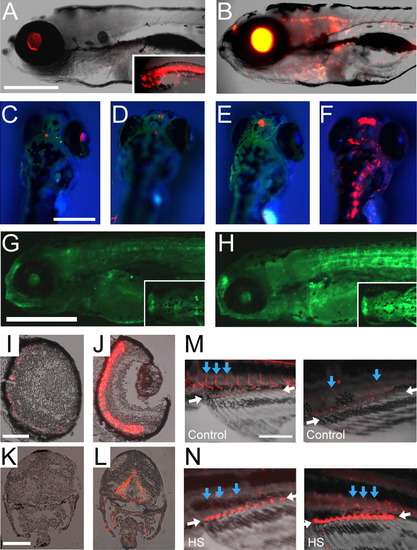
(A) Heterozygotes of sCMV:dsRed line 13-5 displaying the typical low level of dsRed expression at 1 wpf and a dramatically increased level of expression in a putative homozygote (inset) that also displayed an altered body morphology, edema, and decreased capacity for movement. (B) A 7 dpf sCMV:dsRed 13-5 fish displaying dramatically increased dsRed fluorescence following heat shock 3 days earlier (compare to unshocked animal in (A). (C–F) Shown are 7 dpf sCMV:dsRed fish (line 13-5) heat shocked at 16 hpf (C), 1 dpf (D), 2 dpf (E), or 3 dpf (F) and imaged at day 7. Note the increase red fluorescence in fish heat shocked at 3 dpf. (G and H) sCMV:EGFP-1 fish unshocked (G) or shocked (H) show the same response as sCMV:dsRed lines. (I–L) Cross-section of control (I) and heat shocked (J) fish retina and control (K) and heat shocked (L) fish brain stem revealing that induction remains largely confined to cell types with high-level expression at later ages. (M and N) dsRed expression in a young adult sCMV-dsRed line 2-1 fish appendicular muscle of the pelvic fin in control fish (M) and fish subjected to heat shock and imaged 1 week later (N). In (M and N), anterior is left. Scale bars: A–H = 500 μm; I/J = 175 μm; K/L = 200 μm; M/N = 1 mm. |
Reprinted from Gene expression patterns : GEP, 9(1), Suhr, S.T., Ramachandran, R., Fuller, C.L., Veldman, M.B., Byrd, C.A., and Goldman, D., Highly-restricted, cell-specific expression of the simian CMV-IE promoter in transgenic zebrafish with age and after heat shock, 54-64, Copyright (2009) with permission from Elsevier. Full text @ Gene Expr. Patterns