
|
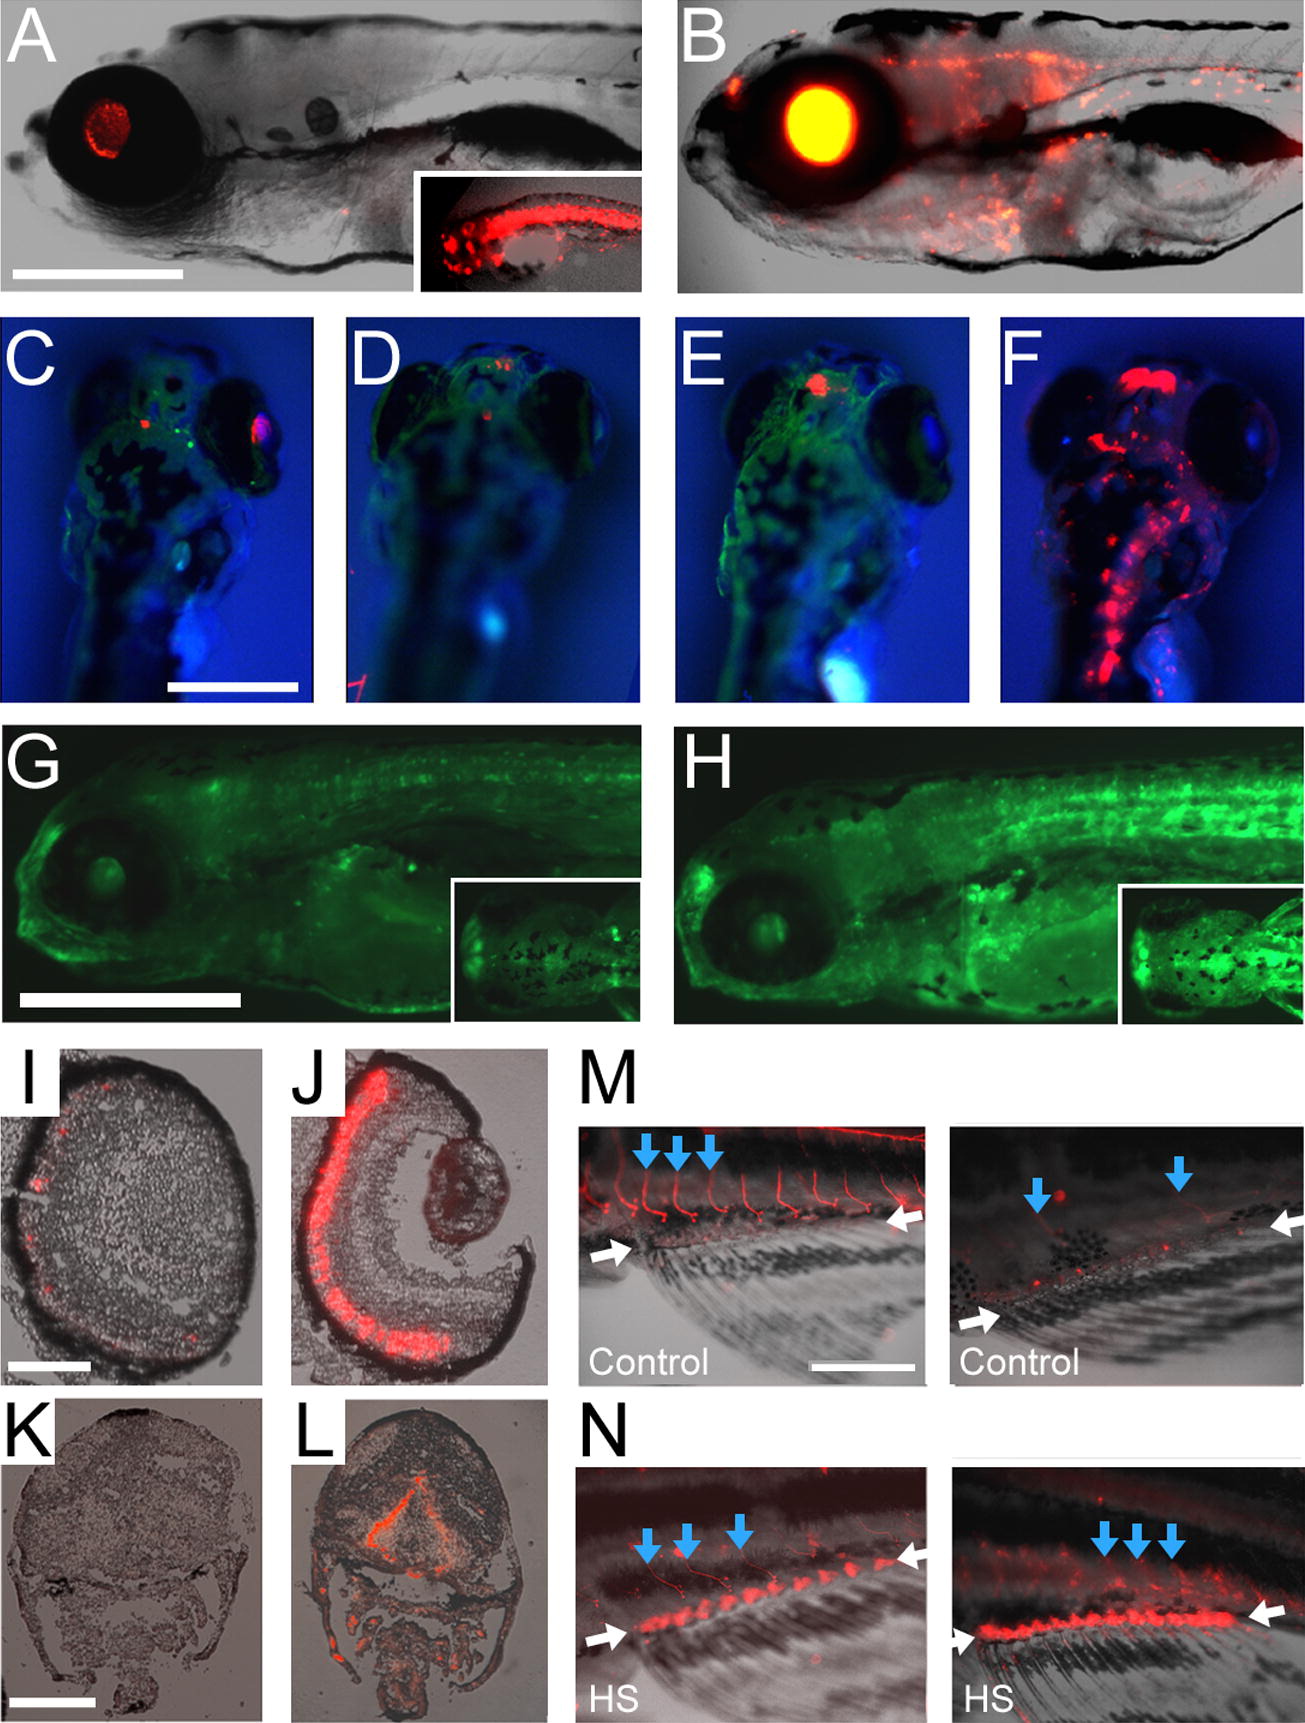
Fig. 7 (A) Heterozygotes of sCMV:dsRed line 13-5 displaying the typical low level of dsRed expression at 1 wpf and a dramatically increased level of expression in a putative homozygote (inset) that also displayed an altered body morphology, edema, and decreased capacity for movement. (B) A 7 dpf sCMV:dsRed 13-5 fish displaying dramatically increased dsRed fluorescence following heat shock 3 days earlier (compare to unshocked animal in (A). (C–F) Shown are 7 dpf sCMV:dsRed fish (line 13-5) heat shocked at 16 hpf (C), 1 dpf (D), 2 dpf (E), or 3 dpf (F) and imaged at day 7. Note the increase red fluorescence in fish heat shocked at 3 dpf. (G and H) sCMV:EGFP-1 fish unshocked (G) or shocked (H) show the same response as sCMV:dsRed lines. (I–L) Cross-section of control (I) and heat shocked (J) fish retina and control (K) and heat shocked (L) fish brain stem revealing that induction remains largely confined to cell types with high-level expression at later ages. (M and N) dsRed expression in a young adult sCMV-dsRed line 2-1 fish appendicular muscle of the pelvic fin in control fish (M) and fish subjected to heat shock and imaged 1 week later (N). In (M and N), anterior is left. Scale bars: A–H = 500 μm; I/J = 175 μm; K/L = 200 μm; M/N = 1 mm.
Reprinted from Gene expression patterns : GEP, 9(1), Suhr, S.T., Ramachandran, R., Fuller, C.L., Veldman, M.B., Byrd, C.A., and Goldman, D., Highly-restricted, cell-specific expression of the simian CMV-IE promoter in transgenic zebrafish with age and after heat shock, 54-64, Copyright (2009) with permission from Elsevier. Full text @ Gene Expr. Patterns