
Fig. 4
- ID
- ZDB-FIG-090113-80
- Publication
- Suhr et al., 2009 - Highly-restricted, cell-specific expression of the simian CMV-IE promoter in transgenic zebrafish with age and after heat shock
- Other Figures
- All Figure Page
- Back to All Figure Page
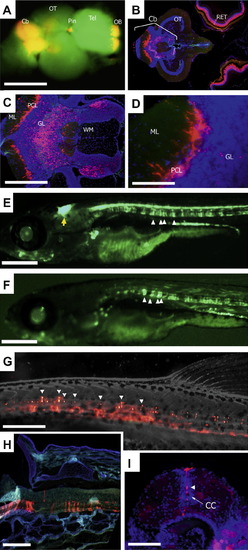
(A) Fluorescent image of explanted whole brain from a sCMV:dsRed transgenic fish crossed with a α1-tubulin:GFP transgenic fish (sCMV:dsRed 2-1 x α1T:EGFP-2) highlighting dsRed expression in the brain regions described in the text. Cerebellum (Cb), optic tectum (OT), pineal body (Pin), telencephalon (Tel), and olfactory bulb (OB). Anterior is to the right in (A–D). (B) Horizontal section through the CNS of an adult sCMV:dsRed transgenic fish imaged at low magnification showing strong dsRed expression in multiple cells and fibers of the cerebellum. (C) Higher magnification of the cerebellum and surrounding area with red reporter expression. ML, molecular layer; PCL, Purkinje cell layer; GL, glomerular layer; WM, white matter tracts. (D) Close-up of the PCL reveals strongly dsRed expressing cells with large cell bodies and extensive arbors and smaller positive cells in the GL. (E) Fluorescent image of the pattern of EGFP expression in a sCMV:EGFP-1 fish at 1 mpf. High-level expression is observed in the cerebellum (yellow arrow) and multiple cells of the spinal cord (white arrows) at this age. (F) As in (E), for line sCMV:EGFP-2. (G) Magnified image of fluorescent cells in the spinal cord of an sCMV:dsRed 2-1 fish (darkfield image overlaid). Red autofluorescence below the midline was obscured to permit better visualization of faint cells in the spinal cord. (H and I) dsRed-expressing cells in the spinal cord in sagittal (H, rostral is left) and cross-sections (I) of the sCMV:dsRed adult fish. Non-red color in (H) is autofluorescence imaged to provide orientation, and blue fluorescence in (I) is DAPI nuclear stain. Arrowhead indicates the cell body of one of the strongly positive cells adjacent to the central canal (CC). Scale bars: A/B = 1 mm, C = 250 μm; D = 100 μm, E/F = 0.7 mm; G = 0.5 mm; H = 250 μm; I = 100 μm. |
| Genes: | |
|---|---|
| Fish: | |
| Anatomical Terms: | |
| Stage Range: | Days 21-29 to Adult |
Reprinted from Gene expression patterns : GEP, 9(1), Suhr, S.T., Ramachandran, R., Fuller, C.L., Veldman, M.B., Byrd, C.A., and Goldman, D., Highly-restricted, cell-specific expression of the simian CMV-IE promoter in transgenic zebrafish with age and after heat shock, 54-64, Copyright (2009) with permission from Elsevier. Full text @ Gene Expr. Patterns