
- Title
-
miR-126 regulates angiogenic signaling and vascular integrity
- Authors
- Fish, J.E., Santoro, M.M., Morton, S.U., Yu, S., Yeh, R.F., Wythe, J.D., Ivey, K.N., Bruneau, B.G., Stainier, D.Y., and Srivastava, D.
- Source
- Full text @ Dev. Cell
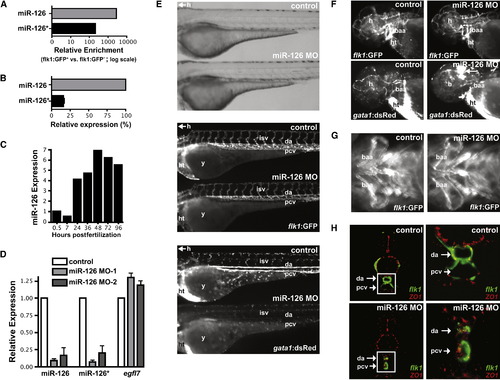
miR-126 Regulates Vascular Integrity and Lumen Maintenance In Vivo (A) miR-126 and miR-126* enrichment (qRT-PCR) in GFP+ endothelial cells from 72 hpf Tg(flk1:GFP)s843 zebrafish compared to GFP- cells. (B) Relative levels of miR-126 and miR-126* in 72 hpf zebrafish embryos. (C) miR-126 expression monitored by qRT-PCR during zebrafish development. (D) Levels of miR-126/126* or egfl7 (across intron containing miR-126) quantified by qRT-PCR in 72 hpf zebrafish injected with miR-126 MOs relative to control. (E) Lateral views of control and miR-126 MO-injected Tg(flk1:GFP)s843; Tg(gata1:dsRed)sd2 zebrafish (72 hpf). Brightfield microscopy (top) revealed no major changes in gross morphology, while flk1:GFP showed normal blood vessel patterning (middle). Presence of blood cells (gata1:dsRed) in the intersomitic vessels (isv), dorsal aorta (da) and primary cardinal vein (pcv) was greatly reduced in morphants (bottom). y, yolksac; h, head; ht, heart. (F) miR-126 morphants (48 hpf) had normal vessel patterning (flk1:GFP), but developed cranial hemorrhages (gata1:dsRed; arrow) in the head. baa, branchial arch arteries. (G) Ventral view of baa suggested smaller luminal size in miR-126 morphants. (H) Transverse section of control or miR-126 MO-treated zebrafish revealed that the da and pcv of morphants had a smaller lumen than controls; higher magnification (right panels) of boxed area shows collapsed da and small pcv in morphants. flk1:GFP, green; ZO-1, an epithelial marker, red. EXPRESSION / LABELING:
PHENOTYPE:
|
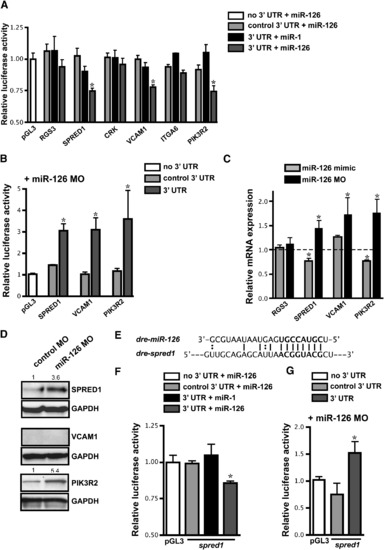
Identification of miR-126 mRNA Targets (A) Relative luciferase activity of constructs containing the 3′ UTR of potential miR-126 targets introduced into HeLa cells in the presence of miR-1 or miR-126. The 3′ UTR was also inserted in the antisense orientation as a control (control 3′ UTR). Firefly luciferase activity for each construct was normalized to the co-transfected Renilla luciferase construct and then normalized to the change in pGL3 luciferase in the presence of microRNA. For each 3′ UTR construct, normalized luciferase activity in the absence of microRNA was set to 1. * p < 0.05 compared to pGL3. (B) Relative luciferase activity of select constructs in (A) in HUVECs upon inhibition of miR-126 with MOs. Normalization was performed as in (A). (C) mRNA levels of potential targets in HUVECs transfected with miR-126 mimic or MO quantified by qRT-PCR. Values are relative to transfection controls. (D) Immunoblot of SPRED1, VCAM1, and PIK3R2 protein in control or miR-126 MO-transfected HUVECs 72 hr post-transfection. GAPDH is shown as a loading control. (E) Sequence complementarity of a potential miR-126 binding site in the zebrafish spred1 3′ UTR. (F and G) Luciferase assays (as in (A) and (B), respectively) using the zebrafish spred1 3′ UTR. |
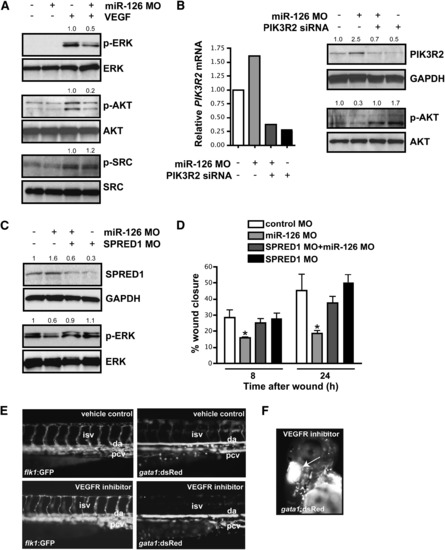
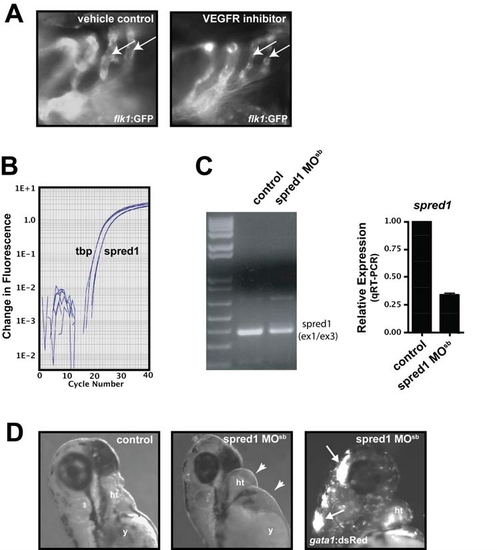
miR-126 Positively Regulates VEGF Signaling in Endothelial Cells by Repressing SPRED1 and PIK3R2 (A) Immunoblot of lysates from HUVECs transfected with control or miR-126 MOs in the presence or absence of VEGF (10 ng/ml, 10 min). VEGF induced phosphorylation of ERK (p-ERK) and AKT (p-AKT), which was blocked by miR-126 inhibition. Total levels of ERK and AKT were not affected. Phosphorylation of SRC was not affected by miR-126 knockdown. Densitometric analysis of normalized protein levels are indicated above immunoblot. (B) PIK3R2 mRNA was knocked-down by RNAi in HUVECs transfected with control or miR-126 MOs (qRT-PCR). Western analysis indicates a decrease in PIK3R2 protein by introduction of siRNA, even in the presence of miR-126 MOs. Knockdown of PIK3R2 rescued the defect in VEGF-dependent phosphorylation of AKT in miR-126 MO-treated cells. (C) Western analysis shows reduced SPRED1 levels by transfection of a MO that blocks SPRED1 translation, even in the presence of miR-126 MO. SPRED1 MO rescued the defect in VEGF-induced phorphorylation of ERK in miR-126 MO-transfected cells. (D) Quantification of percent (%) wound closure of endothelial cells in a “scratch” assay reveals rescue of miR-126 MO effects by knocking down SPRED1. * p < 0.05 compared to control MO. (E) Treatment of 48 hpf embryos with a VEGF receptor inhibitor (Vatalanib, 5 μM, 18 hr) resulted in reduced circulation of blood cells (gata1:dsRed). ISVs (flk1:GFP) appeared to lack a lumen after VEGF inhibition. (F) Hemorrhages also occurred in some embryos treated with VEGF receptor inhibitor (arrow). |
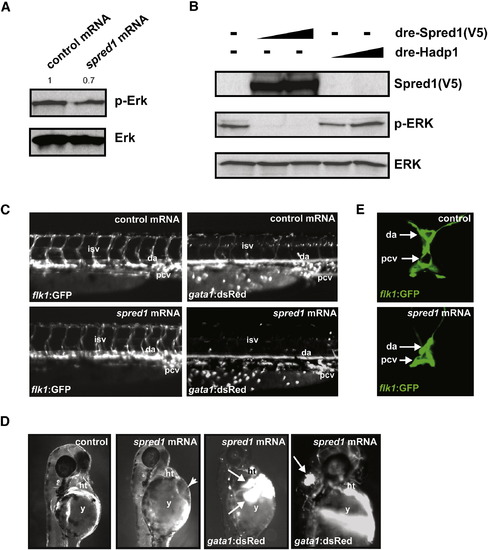
Increased Spred1 Causes Vascular Instability and Hemorrhage Similar to miR-126 Knockdown (A) Levels of phosphorylated Erk were reduced in zebrafish embryos (8 hpf) injected with spred1 mRNA compared to control mRNA (hadp1). Densitometric analysis is shown above. (B) Zebrafish Spred1, but not Hadp1, expression also reduced p-ERK in COS cells as observed by immunoblot. (C) Lateral view of trunk region of 48 hpf embryos after injecting 100 pg of control (hadp1) or spred1 mRNA. flk1:GFP reveals normal vascular patterning but gata1:dsRed shows diminished blood cells in the dorsal aorta (da), primary cardinal vein (pcv), and intersomitic vessels (isv). (D) Injection of spred1 mRNA also resulted in pericardial (2nd panel from right) and cranial (far right) hemorrhages (arrows) visualized by gata1:dsRed marking of blood cells, and edema (2nd panel from left). (E) Confocal analysis of transverse sections of 48 hpf embryos revealed collapsed lumens of da and primary cardinal vein (pcv) in spred1-injected embryos. |
Spred1 and VEGF Signaling Are Required for Vascular Integrity and Function EXPRESSION / LABELING:
PHENOTYPE:
|
Reprinted from Developmental Cell, 15(2), Fish, J.E., Santoro, M.M., Morton, S.U., Yu, S., Yeh, R.F., Wythe, J.D., Ivey, K.N., Bruneau, B.G., Stainier, D.Y., and Srivastava, D., miR-126 regulates angiogenic signaling and vascular integrity, 272-284, Copyright (2008) with permission from Elsevier. Full text @ Dev. Cell