
- Title
-
Dynamics of zebrafish somitogenesis
- Authors
- Schröter, C., Herrgen, L., Cardona, A., Brouhard, G.J., Feldman, B., and Oates, A.C.
- Source
- Full text @ Dev. Dyn.
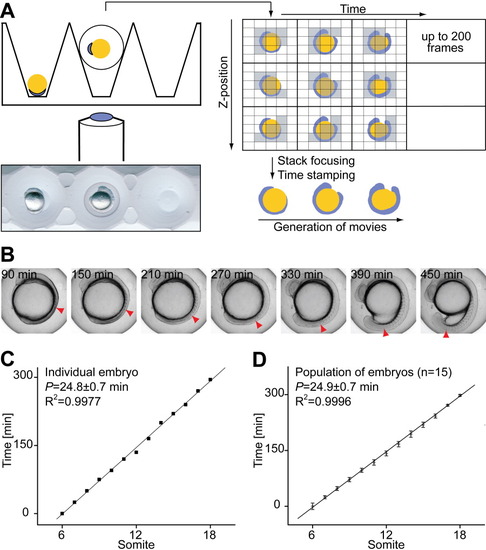
Measurement of trunk somitogenesis period. A: Automated generation of somitogenesis time-lapse movies. Embryos in different orientations are held in defined positions in agarose molds. A motorized stage scans through them at defined time intervals. Focused images are generated from Z-stacks using the ImageJ Stack Focuser, and time-stamped QuickTime movies are automatically generated from the focused images. B: Single focused frames of a representative movie. Red arrowheads mark the most recently formed somite boundary in each frame. C: Period measurement from a single embryo. A movie produced as in A was analyzed from the six-somite stage onward, and formation time of individual somites was normalized relative to somite 6. A linear increase in somite number over time is evident. D: Somitogenesis period of the population. The plot shows normalized mean formation times ± SD of boundaries posterior to somite 6 in a group of embryos. Note that the SD does not increase with the duration of recording. The somitogenesis period of the population was estimated as the slope of the linear regression: P = 24.9 ± 0.7 min, T = 27.1 ± 0.1°C. |
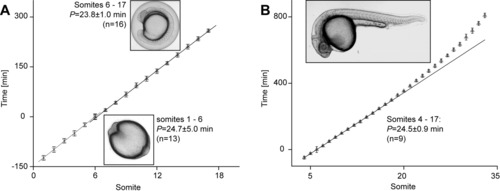
Somitogenesis period at different axial positions. A: Somitogenesis period in the anterior trunk does not differ significantly from the period in the posterior trunk. Populations of embryos from the same clutch were filmed in parallel, either with or without chorion from lateral or dorsal view, respectively. Normalized mean somite formation times ± SD were scored from either set of movies. Linear fits to both data sets (somites 1-6 for the dorsal view, somites 6-17 for the lateral view) yielded slopes that were not significantly different. Note that the limited number of data points for period estimation for the anteriormost somites results in a large confidence interval. T = 27.6 ± 0.1°C. B: Somitogenesis period increases in the tail. Tail outgrowth of embryos homozygous for the nicb107 allele was filmed, and somite formation times were analyzed from somite 4 onward. A linear fit to data points in the trunk region (somites 4-17) indicates nonlinear behavior as somitogenesis proceeds into the tail. T = 27.4 ± 0.1°C. |
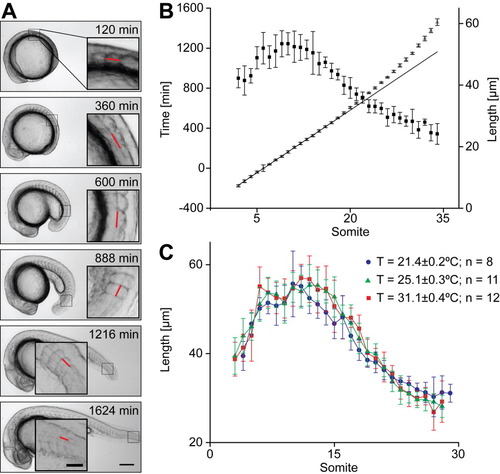
Axial and temperature dependence of somite length. A: Measurement of instantaneous somite length. Somite length was analyzed in focused frames of time-lapse movies by measuring the length of a straight line (red), connecting the intersections of the dorsal limit of the notochord with the two most recently formed somite boundaries. Scale bar = 200 μm in main, 50 μm in inset. B: Somite length along the axis is independent of somitogenesis period. Instantaneous somite length (squares) was measured along the entire axis in a population of nicb107 homozygous embryos and compared with somitogenesis period in the same population (triangles). Somite length increases in the anterior trunk, is approximately constant in the central trunk, and decreases thereafter, independently from somitogenesis period. Error bars show SD of formation time and length measurements. Solid line: Linear fit to estimate somitogenesis period in the trunk. n = 8; P = 41.6 ± 1.2 min; T = 22.7 ± 0.4°C. C: Somite length is independent of developmental temperature. Instantaneous somite length was measured in populations of nicb107 homozygous embryos developing at 21.4°C (blue), 25.0°C (green), and 31.1°C (red). Different temperatures do not lead to a consistent change in instantaneous somite length. Error bars state SD of length measurement. |