
Fig. 1
- ID
- ZDB-FIG-080402-48
- Publication
- Schröter et al., 2008 - Dynamics of zebrafish somitogenesis
- Other Figures
- All Figure Page
- Back to All Figure Page
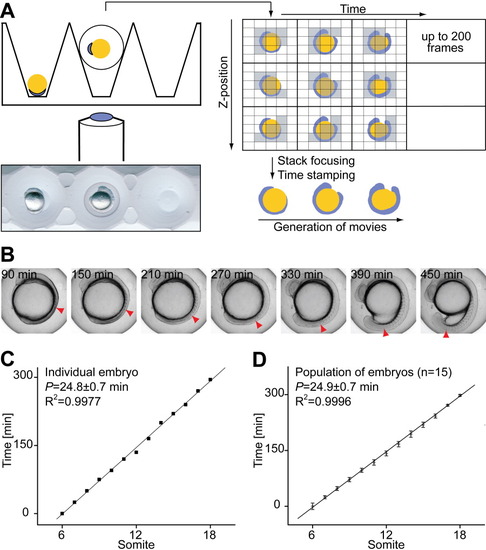
Measurement of trunk somitogenesis period. A: Automated generation of somitogenesis time-lapse movies. Embryos in different orientations are held in defined positions in agarose molds. A motorized stage scans through them at defined time intervals. Focused images are generated from Z-stacks using the ImageJ Stack Focuser, and time-stamped QuickTime movies are automatically generated from the focused images. B: Single focused frames of a representative movie. Red arrowheads mark the most recently formed somite boundary in each frame. C: Period measurement from a single embryo. A movie produced as in A was analyzed from the six-somite stage onward, and formation time of individual somites was normalized relative to somite 6. A linear increase in somite number over time is evident. D: Somitogenesis period of the population. The plot shows normalized mean formation times ± SD of boundaries posterior to somite 6 in a group of embryos. Note that the SD does not increase with the duration of recording. The somitogenesis period of the population was estimated as the slope of the linear regression: P = 24.9 ± 0.7 min, T = 27.1 ± 0.1°C. |