
|
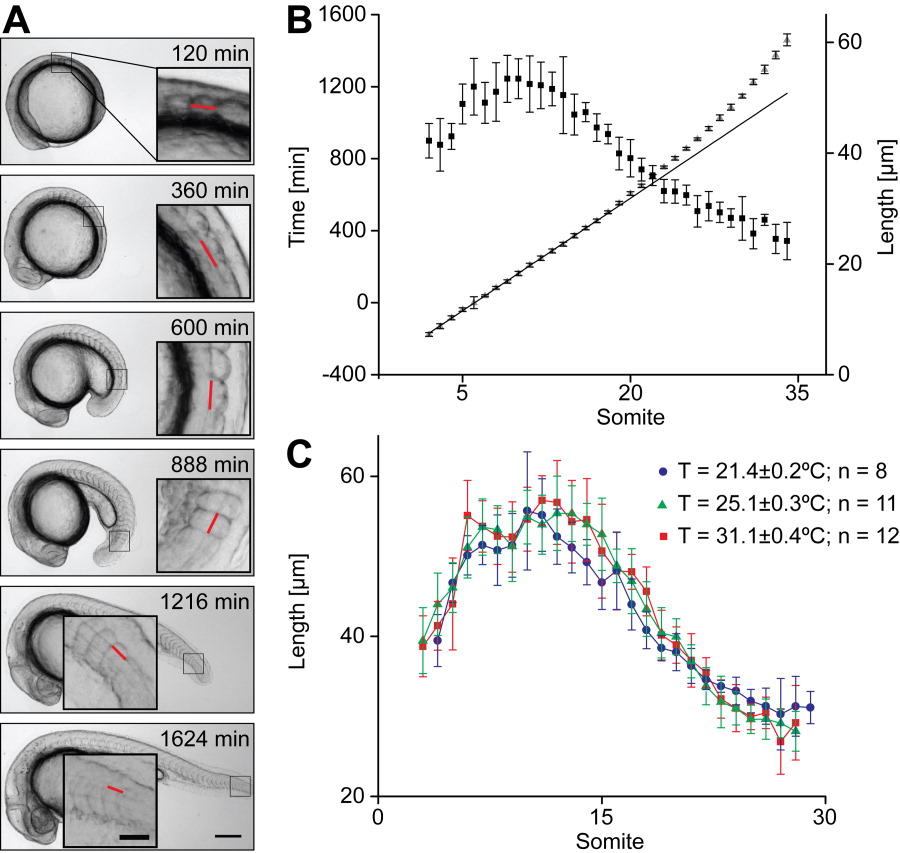
Fig. 4 Axial and temperature dependence of somite length. A: Measurement of instantaneous somite length. Somite length was analyzed in focused frames of time-lapse movies by measuring the length of a straight line (red), connecting the intersections of the dorsal limit of the notochord with the two most recently formed somite boundaries. Scale bar = 200 μm in main, 50 μm in inset. B: Somite length along the axis is independent of somitogenesis period. Instantaneous somite length (squares) was measured along the entire axis in a population of nicb107 homozygous embryos and compared with somitogenesis period in the same population (triangles). Somite length increases in the anterior trunk, is approximately constant in the central trunk, and decreases thereafter, independently from somitogenesis period. Error bars show SD of formation time and length measurements. Solid line: Linear fit to estimate somitogenesis period in the trunk. n = 8; P = 41.6 ± 1.2 min; T = 22.7 ± 0.4°C. C: Somite length is independent of developmental temperature. Instantaneous somite length was measured in populations of nicb107 homozygous embryos developing at 21.4°C (blue), 25.0°C (green), and 31.1°C (red). Different temperatures do not lead to a consistent change in instantaneous somite length. Error bars state SD of length measurement.