
- Title
-
Splicing Segregation: The Minor Spliceosome Acts outside the Nucleus and Controls Cell Proliferation
- Authors
- König, H., Matter, N., Bader, R., Thiele, W., and Müller, F.
- Source
- Full text @ Cell
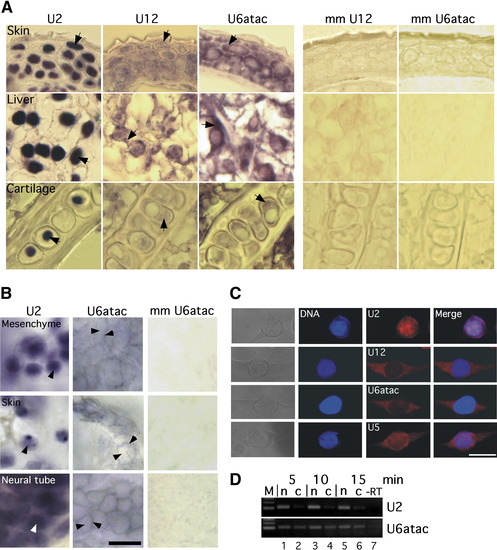
Distinct Subcellular Localization of Minor- and Major-Class snRNAs (A) In situ hybridization of paraffin-embedded tissue sections from adult zebrafish with LNA probes for U2, U12, and U6atac snRNAs. Control hybridizations with mismatch (mm) probes for U12 and U6atac snRNA are shown on the right. Hybridization of digoxygenin (DIG)-labeled LNA probes was detected by an anti-DIG antibody coupled to alkaline phosphatase and NBT/BCIP staining. Arrows point at nuclear (U2) or perinuclear and cytoplasmic staining (U12, U6atac). (B) In situ hybridization of whole-mount zebrafish embryos (24 hpf) using DIG-labeled LNA probes for U2 and U6atac snRNAs, or a 5 mismatch (mm) probe for U6atac snRNA. Arrowheads indicate the center of nuclei. Arrows point to cytoplasmic staining (U6atac). Scale bar indicates 25 μm. (C) Fluorescence in situ hybridization of NIH 3T3 mouse fibroblasts using LNA probes for the snRNAs indicated, visualized by confocal fluorescence microscopy. Nuclear/DNA counterstaining was performed with DRAQ5. Scale bar indicates 20 μm. (D) Detection of U2 and U6atac snRNA upon nuclear-cytoplasmic fractionation of NIH 3T3 cells. Nuclear (n) and cytoplasmic (c) fractions were obtained by differential lysis of plasma and nuclear membranes by nonionic detergents for the times indicated. Total RNA from the fractions was reverse transcribed and analyzed by RT-PCR. -RT corresponds to RT-PCR reaction lacking reverse transcriptase. Amplification reactions were not in plateau phase as verified by different numbers of PCR cycles. |

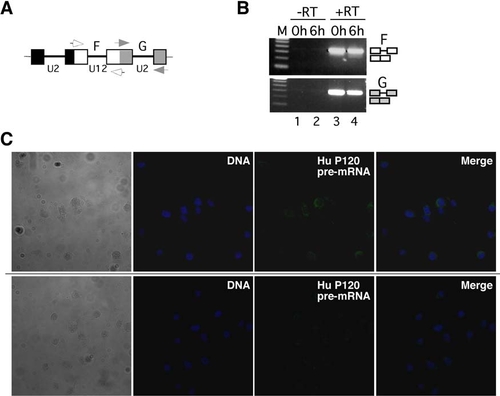
Transcripts Containing Minor Introns Leave the Nucleus, and the Minor Spliceosome Acts in the Cytoplasm (A) Distribution of major- and minor-class intron-containing transcripts after nucleo-cytoplasmic fractionation of NIH 3T3 cells. Nuclear (n) and cytoplasmic (c) fractions were obtained as described in the legend to Figure 1D. Splicing of U2-dependent intron G and the U12-dependent intron F in endogenous P120 pre-mRNA was monitored by RT-PCR using primers as indicated in the scheme (open/gray boxes, exons; lines, introns; arrows, primers). The number of amplification cycles performed is indicated on top. In lanes 9 and 10, 36 cycles were performed. Lanes 7 and 8 correspond to RT-PCR reactions lacking reverse transcriptase. Splicing products are diagrammed on the right (exons, open boxes; introns, lines). M, 100 base pair (bp) DNA ladder; lowest band is 100 bp. (B) Nucleo-cytoplasmic distribution of transcripts from several genes with minor introns upon transfection of NIH 3T3 cells with either a control (cMO) or an antisense-U6atac morpholino oligomer (U6atacMO). RT-PCR analysis of splicing of the single minor-class intron (U12) and of one of the major-class introns (U2) are shown. P120, nucleolar proliferation-associated antigen P120 (U12, intron 6-7; U2, intron 7-8); adprt, poly-ADP-ribosyl transferase (U12, intron 22-23; U2, intron 21-22); and e2f1, E2F1 transcription factor (U12, intron 4-5; U2, intron 2-3). Primers hybridized in the upstream and downstream exons, respectively. For e2f1, an additional intronic forward primer was used. Symbols are as in (A). (C) Confocal fluorescence microscopy of living NIH 3T3 cells transfected with a fluorescein-modified antisense-U6atac morpholino (0.25 nmol) conjugated to either a wild-type NES peptide (NES-U6atac-FL) or a mutated, inactive NES peptide (mNES-U6atac-FL). DNA counterstaining was performed by DRAQ5. (D) Real-time quantitative RT-PCR analysis of intron F splicing from endogenous P120 pre-mRNA. NIH 3T3 cells were mock transfected or transfected with a U6atac morpholino oligomer (0.25 nmol) conjugated to either the wild-type NES peptide (NES-U6atac) or the mutated NES peptide (mNES-U6atac). RNA was prepared 4 hr after transfection, and relative expression levels of spliced and unspliced RNA were determined. Values in the graph are expressed as relative percentage of unspliced RNA (set to 100% in transfections without morpholino conjugate). Error bars indicate standard deviations from three independent transfections. |
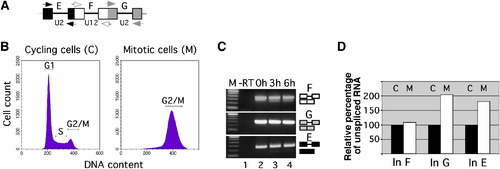
Minor Splicing Evades Mitotic Downregulation (A) Scheme of the P120 pre-mRNA region analyzed for splicing (boxes, exons; lines, introns; arrows, primers). (B) Flow cytometry analysis of cell DNA content from NIH 3T3 cells that grew asynchronously (cycling cells) or were arrested in mitosis by nocodazole treatment. (C) RT-PCR analysis of U2-type (introns E and G) and U12-type (intron F) splicing of transfected, in-vitro-transcribed P120 minigene pre-mRNA (capped and polyadenylated) in mitotic cells, after the times indicated. For primer positions, see (A). -RT corresponds to RT-PCR reaction lacking reverse transcriptase. Correct splicing was verified by sequencing. (D) Analysis of splicing of endogenous P120 pre-mRNA in cycling (label C) and mitotically arrested cells (label M). Relative expression levels of mRNA spliced for the major class introns (In) G and E and for the minor-class intron F were measured by real-time quantitative RT-PCR. Values represent the mean of two experiments and are expressed as relative percentage of unspliced RNA (set to 100% in cycling cells). |
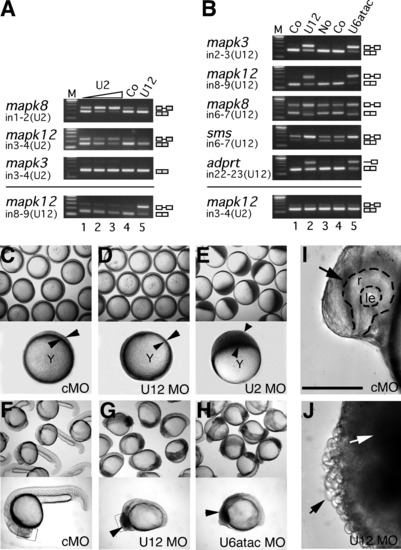
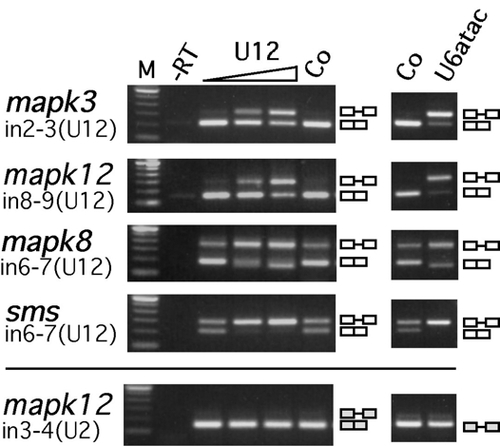
Different Requirements for the Two Spliceosomes in Embryonic Development (A and B) Inhibition of U2-type (A) and U12-type (B) splicing in zebrafish embryos upon injection of antisense morpholinos to snRNAs, analyzed by RT-PCR from RNA of different genes. mapk3 (erk1), mapk8 (jnk1), and mapk12 (sapk3), mitogen-activated kinases 3, 8, and 12, respectively; adprt, poly-ADP-ribosyl transferase; sms, spermine synthase. Embryos were either left uninjected (No) or were injected with control (Co) (standard control morpholino at 0.5 mM in [A]; mismatch morpholinos at 0.1 mM in [B]) or with antisense morpholinos to U2 (0.02, 0.1, and 0.5 mM), U12 (0.01 mM), or U6atac snRNA (0.1 mM). Total RNA was prepared from 30–40 embryos at 9 hpf (A) and 18 hpf (B). Removal of U2-type (U2) and U12-type (U12) introns (in) was analyzed by RT-PCR using primers hybridizing in the upstream and downstream exons, respectively. For adprt, an additional intronic forward primer was used. Splicing products are diagrammed on the right (exons, open boxes; introns, lines). M, 100 bp DNA ladder, lowest band is 100 bp. (C–H) Embryo phenotypes upon injection of snRNA morpholino antisense oligonucleotides. Bright field views of groups (top) or representative individuals (bottom) of injected embryos are shown at the 75%–90% epiboly stage (C–E) or at 24 hpf (F–H). Epiboly movement is arrested in U2 morpholino-injected embryos (U2MO) as indicated by the accumulation of blastomeres on the top of the yolk cell (arrowheads in [E]) while the blastoderm (indicated by arrowheads in [C] and [D]) migrates normally around the yolk cell, Y, in standard control (cMO) or U12 morpholino (U12MO)-injected embryos. At 24 hpf, U12 and U6atac morpholino-injected (U6atacMO) embryos show a comparable, arrested phenotype indicated by dark cells spreading from anterior in the brain toward the somites (arrowheads in [G] and [H]) while cMO-injected embryos develop normally (F). (I and J) Brain areas as depicted in rectangular frames in (F) and (G) are enlarged in (I) and (J). Arrow in (I) indicates the retina on the forebrain of a normally developing embryo. Dashed line indicates the outline of the retina (r) and the lens (le). Black arrow in (J) points at spherical cells losing cell-cell contact, white arrow indicates dark areas that contain cells that are rounding up and show an arrested phenotype on the equivalent anterior region of the embryo as shown in (I). Scale bar indicates 100 μm. PHENOTYPE:
|
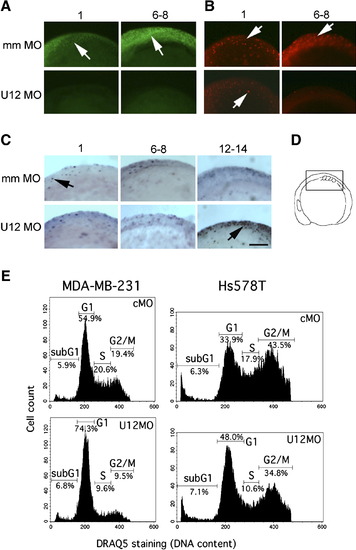
Interference with Minor Spliceosome Function Blocks Cell-Cycle Progression (A) BrdU incorporation in mismatch control morpholino-injected embryos (mm MO, 0.1 mM) and U12 morpholino “knockdown” embryos (U12MO, 0.01 mM). BrdU-incorporating cells were visualized by staining with an FITC-conjugated anti-BrdU antibody followed by fluorescence microscopy (arrows). (B) Analysis of cells in mitosis (M) phase in embryos injected as in (A) by using anti-phospho-histone H3/Cy3 fluorescence staining (arrows). (C) Detection of apoptosis (arrows) in control- and U12 morpholino-treated embryos by TUNEL staining. Numbers above the panels represent the number of somites in the embryos as indication of their developmental stages. Scale bar indicates 100 μm. (D) Embryos in all panels are shown in lateral views (anterior to the left) on to the midline at the level of developing somites, as indicated in the schematic drawing. (E) Morpholino-mediated interference with minor-class splicing inhibits entry into DNA-synthesis (S) phase in human cell lines. Cell-cycle profiles measured by flow cytometry of MDA-MB-231 and Hs578T breast cancer cells after transfection with either a standard control morpholino (cMO) or an antisense-U12 morpholino (U12MO). Cells were ethanol fixed 24 hr after transfection, and cellular DNA was stained with DRAQ5. SubG1 indicates cells with DNA content < 2n. PHENOTYPE:
|
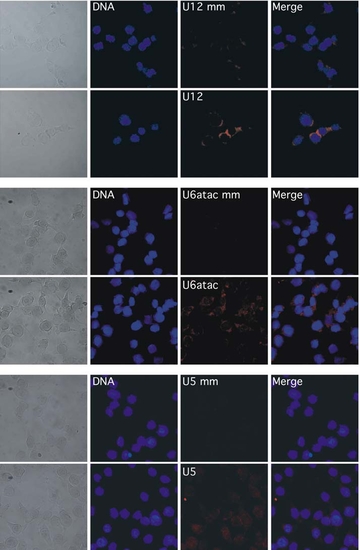
Fluorescence in situ hybridization in NIH3T3 mouse fibroblasts using DIG-labeled LNA probes and corresponding mismatched probes for the snRNAs indicated, visualized by confocal fluorescence microscopy. Nuclear/DNA counterstaining was performed with DRAQ 5. |
Differential Activity of the Minor and the Major Spliceosome on an In Vitro-Synthesized Pre-mRNA Localized in the Cytoplasm |
Dose Dependency of Morpholino-Mediated Interference with U12-Type Splicing in Zebrafish Embryos |
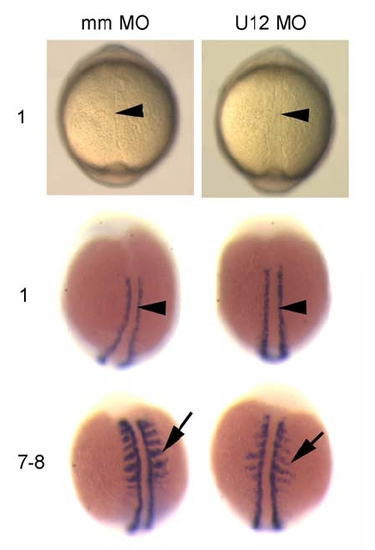
Developmental Patterning of the Midline and Somite Segmentation Are Unaffected in U12-MO-Injected Embryos during Early Somitogenesis EXPRESSION / LABELING:
|

Unillustrated author statements PHENOTYPE:
|
Reprinted from Cell, 131(4), König, H., Matter, N., Bader, R., Thiele, W., and Müller, F., Splicing Segregation: The Minor Spliceosome Acts outside the Nucleus and Controls Cell Proliferation, 718-729, Copyright (2007) with permission from Elsevier. Full text @ Cell