
- Title
-
Activin-betaA Signaling Is Required for Zebrafish Fin Regeneration
- Authors
- Jazwinska, A., Badakov, R., and Keating, M.T.
- Source
- Full text @ Curr. Biol.
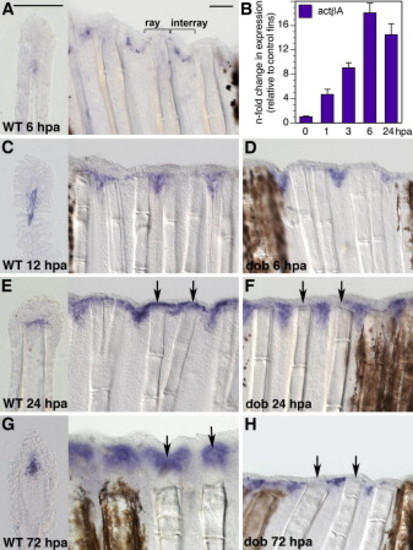
actβA Is Expressed in an Interray Domain and in the Blastema (A and C–H) In situ hybridization of fins with actβA mRNA antisense probe (blue staining). Scale bars in (A) represent 100 μm. (B) Real-time RT-PCR quantification of actβA expression in fins at 1, 3, 6, and 24 hpa (n = 4) relative to control fins at 0 hpa (n = 3), which as a calibrator sample were normalized to 1.00. Error bars represent the standar error of the mean (SEM). p < 0.001 indicates a significant difference from the control. n refers to the number of biological samples; each sample was prepared from 15–20 fins. (A, C, E, and G) Wild-type fins at different stages of regeneration. Each panel shows a longitudinal section (left) and a fragment of the whole-mount fin (right). At 6 hpa, actβA is detected in scattered mesenchymal cells along the wound epidermis of the interrays (A). The ray contains dermal bones; the interray spans soft tissue between rays. At 12 hpa, the expression expands in the mesenchyme of the interray pockets at the cut edge (C). At 24 hpa, actβA is additionally induced in the mesenchyme underlying the wound epidermis of the rays, where the blastema is formed (arrows) (E). At 72 hpa, the expression is strongly detected in the blastema (arrows) (G). (D, F, and H) actβA expression is independent of FGF20a signaling. dob homozygous mutant fins were incubated at a restrictive temperature of 33°C. actβA mRNA is expressed in the interray pockets of dob mutant fins at 6 hpa (D), 24 hpa (F), and 72 hpa (H). No or little activin A expression is detected in the ray mesenchyme (arrows) because the blastema fails to form in dob mutants (n = 6). |
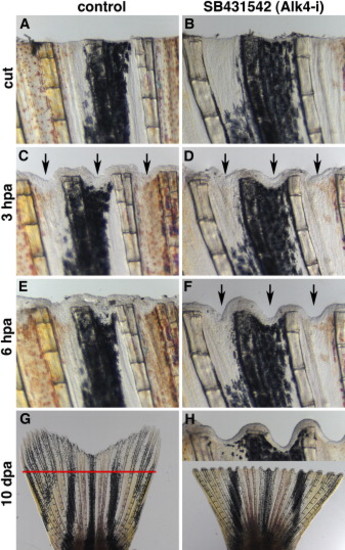
Inhibition of ActβA Signaling Blocks Zebrafish Fin Regeneration with the Serrate Phenotype (A and B) Fins shortly after amputation. n = 4. The scale bar in (A) represents 200 μm. (C and D) After 3 hpa, the epidermis covered the wound. The interrays acquired indentations along the amputation plane, as indicated by arrows in both control (C) and Alk4-i-treated fins (D). (E and F) At 6 hpa, the interray gap closure occurs in control fins (E) but is suppressed in the presence of the inhibitor (arrows in [F]). (G and H) After 10 dpa, the control fins completed regeneration (G), whereas the fins treated with the inhibitor did not regenerate and displayed the serrate phenotype, as seen in the inset (H). The red line in (G) marks the amputation plane. |
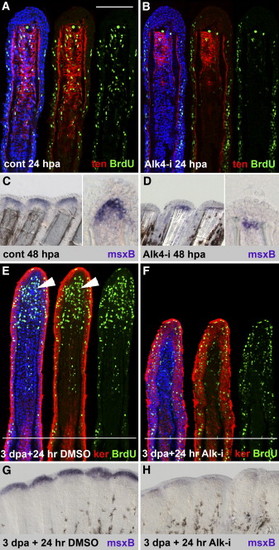
ActβA Signaling Is Required for Blastema Outgrowth and Maintenance (A and B) Longitudinal sections of the fin rays at 24 hpa, triply stained with BrdU antibody in green, anti-tenascin in red, and ToPro3 in blue. In the control, the enhanced number of BrdU-positive cells in the epidermis and mesenchyme indicates a proliferative phase of regeneration (A). The mesenchymal domain with proliferating cells overlaps with the tenascin domain. Fins treated with 10 μM Alk4-i contain an enhanced number of BrdU-positive cells in the epidermis, but mesenchymal proliferation is decreased (B). The extent of tenascin domain is reduced to half size when compared to control (two to three representative sections of four fins were analyzed). The scale bar in (A) represents 100 μm. (C and D) In situ hybridization of fins with msxB antisense probe. At 48 hpa, control fins display strong msxB expression distally from the amputation plane in the blastema, as seen on a whole mount (left panel) and a longitudinal section (right panel) (C). Inhibition of ActβA completely depletes msxB (35% of the rays in five fins) or reduces msxB expression to a single row of mesenchymal cells that remain at the amputation plane (65% of the rays in five fins) (D). (E and F) Longitudinal sections of the fin rays at 4 dpa (3 days at normal conditions and 24 hr with 0.1% DMSO) triply stained with BrdU antibody in green, anti-pan-keratin in red, and DAPI in blue. The white lines demarcate the amputation plane. In control fins, the blastema (arrowheads) displays a massive proliferation, as visualized by BrdU incorporation, and no keratin staining (E). The intensity of keratin is correlated with mesenchymal differentiation: high levels in the proximal mesenchyme (above the amputation plane) and no staining in the blastema. Keratin staining strongly labels the epidermis. Fins regenerating in normal conditions for 3 days and then transferred to water with Alk4-i for the next 24 hr (drug-shift experiment) are shown (F). The smaller size of the outgrowth and reduction of blastemal proliferation demonstrates a block of normally initiated regeneration after the exposure to the drug. Two to three representative sections of four fins were analyzed. (G and H) In situ hybridization of fins with msxB antisense probe. In control fins at 4 dpa (3 days at normal conditions and 24 hr with 0.1% DMSO), msxB mRNA is detected in the blastema of the outgrowth (G). msxB expression is strongly diminished in fins exposed to Alk4-i for 24 hr starting at 3 dpa (four out of six fins). (H) |
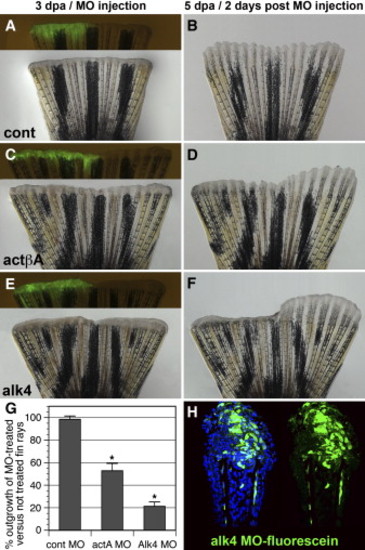
Morpholino-Mediated actA and alk4 Knockdowns Impair Fin Regeneration (A–F) Fins microinjected on one side with control (A and B), actA (C and D), and alk4 (E and F) fluorescein-tagged MOs and then electroporated. Bright-field and fluorescent images show fins at 3 dpa shortly after MO delivery to the regenerate (A, C, and E). Fluorescent MOs (green) are seen only in the injected half of the fin. The remaining noninjected half of the fin served an internal control for the growth rate. Corresponding images of the fins 2 days after MO delivery (5 dpa) are shown (B, D, and F). The control MO does not affect the size of the outgrowth relative to the noninjected side of the fin (B). The actβA and alk4 MOs impair the growth of the injected fin relative to the noninjected side, leading to the asymmetric shape of the regenerate (D and F). (G) Graph comparing the length of regenerates that regrew within 2 days after MO delivery in relation to the nontreated fin regenerate. It depicts the percent length of the outgrowth of the experimental side in relation to the control side (ten fins were analyzed, five of which were either ventrally or dorsally injected). Error bars represent the SEM. The asterisks denote the significant difference, p < 0.005. (H) Longitudinal section of the fin at 2 days after the alk4 fluorescent MOs delivery (5 dpa). Fluorescent (green) cells are identified in the epidermis and within the mesenchymal tissue distal to the amputation plane, indicating the efficiency of MO incorporation. DAPI in blue labels all nuclei. PHENOTYPE:
|
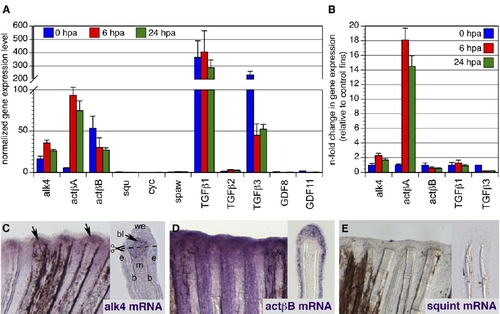
actβA Is Markedly Increased during Fin Regeneration in Comparison to Other Candidate Genes (A) Quantification of expression levels of alk4 and Alk4/5/7 ligands normalized to ubiquitously expressed β-actin1 and β-actin2 reference genes in amputated fins at 0 hpa (n = 3), 6 hpa (n = 4), and 24 hpa (n = 4). The normalized gene expression (NGE) values were calculated with the Pfaffl method and multiplied by a factor of 10,000. squint, cyclops, southpaw, TGFβ2, GDF8, and GDF11 have very low NGE values, indicating that they are not significantly expressed in fins. Error bars indicate the SEM, and n refers to the number of biological samples; each sample was prepared from 15–20 fins. (B) n-fold change in NGE in regenerating fins at 6 hpa and 24 hpa (test samples) relative to cut fins at 0 hpa, which as a calibrator sample were normalized to 1.00. alk4 displays nearly 2-fold induction in fins at 6 and 24 hpa; actβA is the only Alk4/5/7 ligand significantly upregulated during fin regeneration. Error bars indicate the SEM. (C–E) In situ hybridization of fins at 24 hpa. Each panel shows a fragment of a whole-mount (left) and a longitudinal section through the ray (right). In this and subsequent figures, the fins are oriented with the distal edge up. alk4 mRNA (purple) is weakly ubiquitously expressed with upregulation in the blastema (arrows) and the disorganized mesenchyme; "b" indicates bones, "e" indicates epidermis, "m" indicates mesenchyme, "we" indicates wound epidermis, and "bl" indicates blastema (C). actβB mRNA is detected in the entire epidermis (D). No labeling was detected with a squ mRNA antisense probe (E). EXPRESSION / LABELING:
|
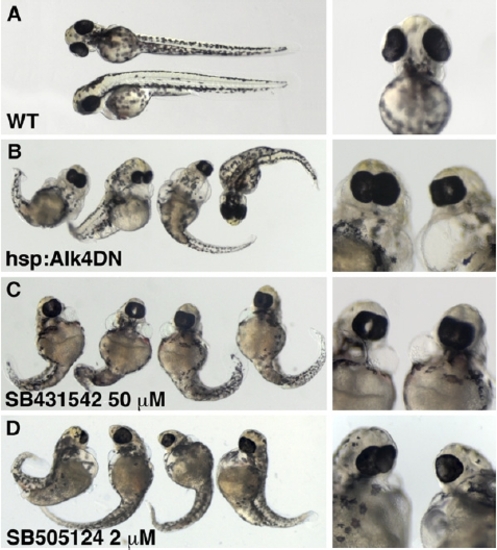
SB431542 and SB505124 Cause the Same Embryonic Phenotype as Overexpression of a Dominant-Negative Alk4 Receptor. Embryos were analyzed 3 days after fertilization. (A) Wild-type. (B) The transgenic embryos hsp:Alk4DN-GFP carry a construct with the coding sequence of the zebrafish alk4 receptor with a point mutation to replace highly conserved lysine K234 with arginine that is predicted to delete kinase function. The gene is fused to green fluorescent protein (GFP) and it is cloned under heat-shock-protein 70 promoter [S3]. For the induction of the expression of the construct, embryos were heat-shocked at 38°C for 1 hr at shield stage. (C and D) Embryos were treated with 50 μM SB431542 (Alk4-i) (C) and 2 μM SB505124 (D) starting at the two-cell stage. The morphological defects caused by the overexpression of a dominant-negative Alk4 receptor and inhibitor treatment are the same: the reduction of the head size, eye fusion or cyclopia, and perturbations of the body axis. This phenotype was highly penetrant, with 80% to 90% of embryos (n = 100) showing significant defects. PHENOTYPE:
|
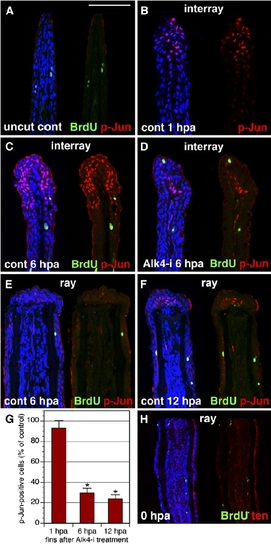
The Interray Gap Closure Is Associated with c-Jun Phosphorylation. (A–F) Longitudinal fin sections triply stained with p-Jun antibody in red, anti-BrdU in green, and ToPro3 in blue to visualize all nuclei. A presence of only few BrdU-positive cells indicates that cell proliferation does not contribute to the interray gap closure. In (A), the uncut control fin does not contain p-Jun nuclear staining. The scale bar represents 100 μm. In (B), a control fin at 1 hpa is shown. p-Jun positive cells are detected only in the wound epidermis of the interrays. No staining is observed in the proximal fin. In (C), a control fin at 6 hpa is shown (C). p-Jun antibody labels an elongated cap of epidermal cells in the distal interrays. In (D), a fin at 6 hpa treated with Alk-i inhibitor is shown. Only a few p-Jun-positive cells are identified in the distal interrays, as compared to the control (C). In (E), in contrast to the interray regions, the epidermis covering the rays does not contain p-Jun-positive cells at 6 hpa. In (F), the wound epidermis of the rays starts to acquire p-Jun-positive cells at 12 hpa (arrows). (G) Quantification of phospho-c-Jun (p-Jun)-positive cells in fins exposed to 10 mMAlk-i relative to the control, which was normalized to 100%, at 1 hpa, 6 hpa, and 12 hpa (n = 10, where two or three representative sections were analyzed from four fins). Scale bars represent the SEM. p < 0.01 indicates a significant difference between the control and inhibitor-treated fins. (H) Control fin immediately after amputation (0 hpa) stained for BrdU in green and tenascin in red. Fins were incubated with BrdU for 6 hr before fin collection. Only few scattered nuclei are BrdU positive. Tenascin staining highlights the epidermal-mesenchymal boundary in the fin. In contrast to the regenerating fins at 24 hpa (Figures 3A and 3B), mesenchyme is not labeled by tenascin-antibody staining. |
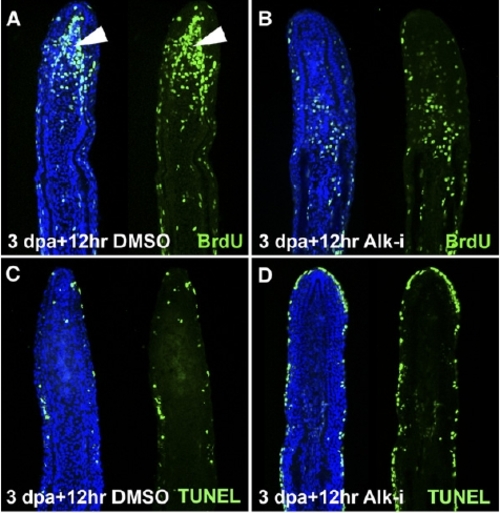
ActβA Signaling Is Required for Blastemal Proliferation. (A–D) Longitudinal sections of fin rays at 3.5 dpa. In control fins, the blastema (arrowheads) displays a massive proliferation as visualized by BrdU incorporation in green (A) and only sparse mesenchymal cells labeled by TUNEL cell-death assay in green (C). Fins regenerating in normal conditions for 3 days and then transferred to water with Alk-i for the next 12 hr display a reduction of blastemal proliferation (B). No enhancement in mesenchymal cell death is present after the drug shift (D). Cell death is detected in the outer layers of the epidermis. (E and F) Quantification of BrdU-positive cells in the epidermis and in the mesenchyme after inhibitor treatment for 24 hpa starting immediately after amputation (E) and after the drug shift (3 days at normal conditions, followed by the next 6, 12 or 24 hr with Alk4-i (F). The values are presented as a percentage of the control samples, which were set as 100%. Error bars represent the SEM. n = 10 (two or three representative sections from four fins were analyzed). *p < 0.01 indicates a significant difference between inhibitor-treated fins and the control. |
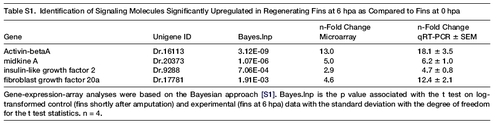
Gene-expression-array analyses were based on the Bayesian approach [S1]. Bayes.lnp is the p value associated with the t test on log-transformed control (fins shortly after amputation) and experimental (fins at 6 hpa) data with the standard deviation with the degree of freedom for the t test statistics. n = 4. EXPRESSION / LABELING:
|

Unillustrated author statements PHENOTYPE:
|