
- Title
-
Tob1 controls dorsal development of zebrafish embryos by antagonizing maternal beta-catenin transcriptional activity
- Authors
- Xiong, B., Rui, Y., Zhang, M., Shi, K., Jia, S., Tian, T., Yin, K., Huang, H., Lin, S., Zhao, X., Chen, Y., Chen, Y.G., Lin, S.C., and Meng, A.
- Source
- Full text @ Dev. Cell
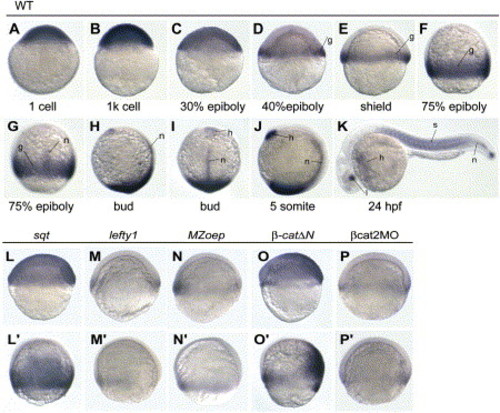
Spatiotemporal Expression Pattern of tob1a and Its Regulation (A–K) Expression pattern of tob1a, detected by whole-mount in situ hybridization, at indicated stages. Embryo orientations: (A–F), (H), and (J), lateral views with the animal pole oriented at the top; (G) and (I), dorsal views with the animal pole oriented at the top; (K), anterior is oriented toward the left. The indicated domains: g, germ ring; h, prechordal/mesoderm/hatching gland; l, lens; n, notochord; s, somites. (L–P′) tob1a expression in embryos injected with indicated mRNA species or in MZoep mutants. Except for (L′), which is a dorsal view, panels are shown in lateral views with the animal pole oriented at the top and dorsal oriented toward the right. (L–P) show the shield stages; (L′–P′) show the 75% epiboly stage. Injection doses: sqt, 0.5 pg; lefty1, 50 pg; β-catΔN, 10 pg; βcat2MO, 20 ng. |
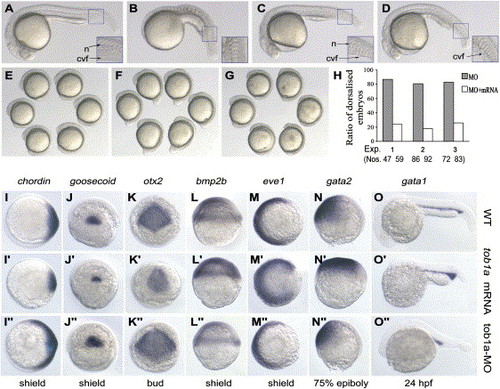
Effects of tob1a Overexpression and Knockdown in Zebrafish Embryos (A–H) Lateral views of live embryos at (A–D) 24 hpf or at the (E–G) 6-somite stage. (A) Wild-type embryo. A caudal ventral region was enlarged in the insert so that the notochord (n) and the caudal ventral fin (cvf) can be seen (same for other pictures). (B) Injection with 400 pg tob1a mRNA resulted in loss of the head and notochord. (C) Injection with 12 ng tob1a-MO led to loss of the caudal ventral fin. Data were averaged from three independent experiments and are expressed as means plus standard deviations. (D) An embryo coinjected with 100 pg tob1a mRNA and 12 ng tob1a-MO showed normal morphology. Data were averaged from three independent experiments and are expressed as means plus standard deviations. (E) Wild-type embryos. (F) Embryos injected with 12 ng tob1a-MO showed early tail protrusion. (G) Embryos coinjected with 100 pg tob1a mRNA and 12 ng tob1a-MO had normal morphology. (H) The ratios of dorsalized embryos, as shown in (F), in three independent experiments after injections. Data were averaged from three independent experiments and are expressed as means plus standard deviations. The number of calculated embryos is indicated below each bar. (I–O″) Expression patterns of marker genes in (I–O) wild-type or embryos injected with either (I′–O′) 400 pg tob1a mRNA or (I″–O″) 15 ng tob1a-MO. Embryos for chordin, otx2, and eve1 are shown in animal pole views with dorsal oriented toward the right; the embryo for goosecoid is shown in a dorsal view with the animal pole oriented toward the top; and embryos for bmp2b and gata2 are shown in lateral views with dorsal oriented toward the right. Developmental stages are indicated at the bottom. Relevant statistical data are presented in Figure S1. |
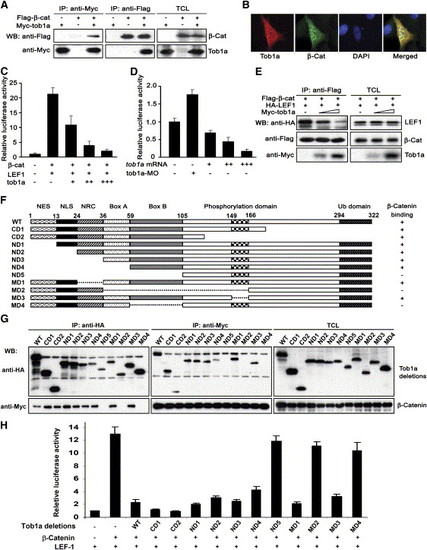
Biochemical Analyses of the Tob1a and β-Catenin Interaction Unless otherwise stated, the following assays were performed in human HEK293T cells. (A) Interaction between Myc-tob1a and Flag-β-catenin. TCL indicates total cell lysate, which is consistently used hereafter. (B) Colocalization of overexpressed Myc-tob1a (red) and HA-β-catenin (green) in HeLa cells. DAPI was used to identify nuclei. (C) β-catenin/LEF1-stimulated expression of the LEF1-luciferase reporter was inhibited by cotransfection of tob1a plasmid DNA at 100 ng (+), 200 ng (++), or 300 ng (+++). (D) Expression of the LEF1-luciferase reporter in zebrafish embryos was inhibited by tob1a mRNA injection at 150 pg (+), 300 pg (++), or 450 pg (+++), but it was enhanced by injection with 15 ng tob1a-MO. Embryos were injected at the one-cell stage, and luciferase activity was analyzed at the bud stage. (E) Tob1a suppressed association of β-catenin with LEF1. Myc-tob1a doses: 1 μg and 3 μg, respectively. (F) Schematic of different tob1a deletion constructs. NES, nuclear exportation signal; NLS, nuclear localization signal; NRC, nuclear receptor coactivator binding domain; Ub, ubquitination domain. (G) Interactions between Myc-β-catenin and different Tob1a deletion mutants with HA tag. (H) Effect of different Tob1a deletion mutants on β-catenin/LEF1-stimulated expression of the LEF1-luciferase reporter. Note that the mutants ND5, MD2, and MD4, all of which lack the Box B domain, failed to inhibit the reporter activation. |
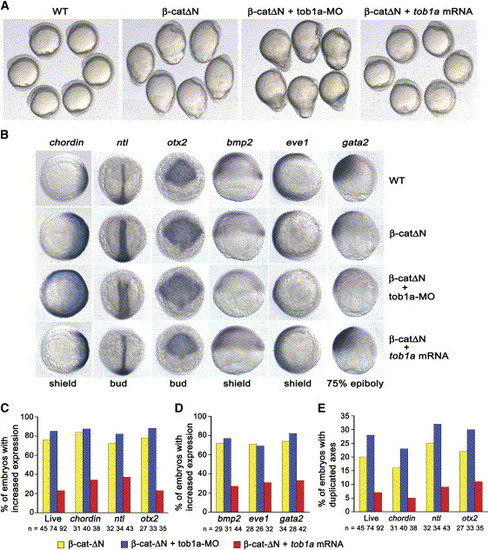
Genetic Interaction between tob1a and β-Catenin Activity in Zebrafish Embryos Injection doses: 5 pg for β-catΔN mRNA, 100 pg for tob1a mRNA, and 15 ng for tob1a-MO. (A) Morphology of live embryos at the 5-somite stage. (B) Expression of the marker genes (indicated on the top) at the indicated stages (bottom). Orientations of embryos: animal pole views with dorsal oriented toward the right for chordin and eve1; dorsoanterior views for otx2; dorsal views with the animal pole oriented toward the top for ntl; and lateral views with dorsal oriented toward the right for bmp2 and gata2. (C and D) Statistical data for (A) and (B), respectively. (E) The ratios of embryos with duplicated axes that were recognized by morphological observation at the 5-somite stage or molecular examinations. |
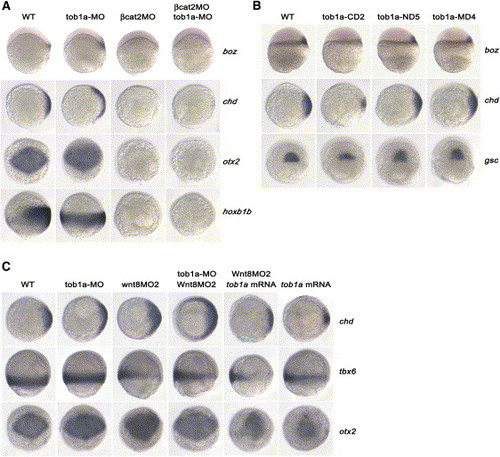
Genetic Interactions between tob1a and Maternal or Zygotic Wnt/β-Catenin Signals (A) Interaction between tob1a and maternal Wnt/β-catenin activity. After injection with 20 ng βcat2MO, 20 ng tob1a-MO, or both (indicated on the top) at the one-cell stage, embryos were examined for boz and chordin (chd) expression at the 30% epiboly stage and for otx2 and hoxb1b expression at the 90% epiboly stage (indicated on the right). Embryos are shown in lateral views with dorsal oriented toward the right for boz and hoxb1b, in animal pole views with dorsal oriented toward right for chd, and in anterodorsal views with anterior oriented toward the top for otx2. (B) Effect of overexpression of tob1a mutants on early dorsoventral patterning. Embryos were injected with 400 pg of each mRNA species at the one-cell stage and were examined for boz expression at the oblong stage and for chd and goosecoid (gsc) expression at the shield stage. Embryos are shown in lateral views with dorsal oriented toward the right for boz, in animal pole views with dorsal oriented toward the right for chd, and in dorsal views with animal pole oriented toward the top for gsc. For details for tob1a mutants, see Figure 3F. (C) Interaction between tob1a and zygotic Wnt/β-catenin activity. Injections were done at the one-cell stage at the dose of 20 ng for tob1a-MO, 8 ng for wnt8MO2, or 400 pg for tob1a mRNA. Embryos are shown in dorsal views with dorsal oriented toward the right for chd at the shield stage, in lateral views with dorsal oriented toward the right for tbx6 at the 75% epiboly stage, and in anterodorsal views with anterior oriented toward the top for otx2 at the 90% epiboly stage. EXPRESSION / LABELING:
|
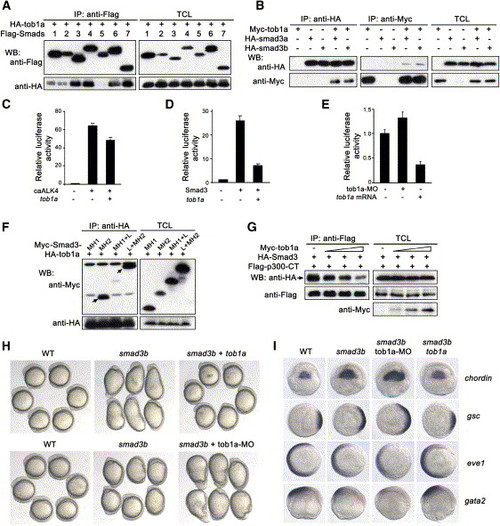
Tob1a Interacts with Smad3 and Inhibits Its Activity (A) Interactions of Tob1a with different mammalian Smads in HEK293T cells. (B) Zebrafish Tob1a-Smad3a or Tob1a-Smad3b interactions in HEK293T cells. (C) Overexpression of tob1a attenuated caALK4-stimulated expression of the reporter CAGA12-luciferase in Mv1lu cells. Data were averaged from three independent experiments and are expressed as means plus standard deviations. (D) Overexpression of tob1a attenuated Smad3-stimulated CAGA12-luciferase expression in Mv1lu cells. Data were averaged from three independent experiments and are expressed as means plus standard deviations. (E) CAGA12-luciferase expression in zebrafish embryos was inhibited by injecting 400 pg tob1a mRNA, but it was enhanced by injecting 15 ng tob1a-MO. Data were averaged from three independent experiments and are expressed as means plus standard deviations. (F) Mapping of Smad3 domains that are required for binding Tob1a. Note that only the MH2 or the Linker plus MH2 domains was strongly bound to Tob1a (indicated by arrows), while the MH1 plus Linker was weakly bound to Tob1a. (G) Binding of HA-Smad3 to Flag-p300-CT (containing the C-terminal region of p300) was inhibited by coexpression of an increasing amount of tob1a (0.5 μg, 1 μg, and 4 μg) in HEK293T cells. The band for HA-Smad3/Flag-p300-CT complexes is indicated by an arrow. (H) Morphological changes in injected embryos at the 5-somite stage. Embryos injected with 50 pg smad3b mRNA were remarkably elongated (middle, top panel); this phenotype was alleviated by coinjection with 100 pg tob1a mRNA (right, top panel). Injection with 25 pg smad3b mRNA caused a less severe dorsalized phenotype (middle, bottom panel), which was strengthened by coinjection with 15 ng tob1a-MO (right, bottom panel). (I) Changes in expression of marker genes at the shield stage. Injection with 50 pg smad3b resulted in the expansion of expression domains of the dorsal markers chordin and gsc and the reduction of expression of the ventral markers eve1 and gata2. Effects of smad3b overexpression were enhanced by injection with 15 ng tob1-MO, but they were inhibited by injection with 100 pg tob1a mRNA. Embryos are shown in dorsal views with the animal pole oriented toward the top for chordin, in animal pole views with dorsal oriented toward the right for gsc and eve1, or in lateral views with dorsal oriented toward the right for gata2. Corresponding statistical data are shown in Figure S8. EXPRESSION / LABELING:
|
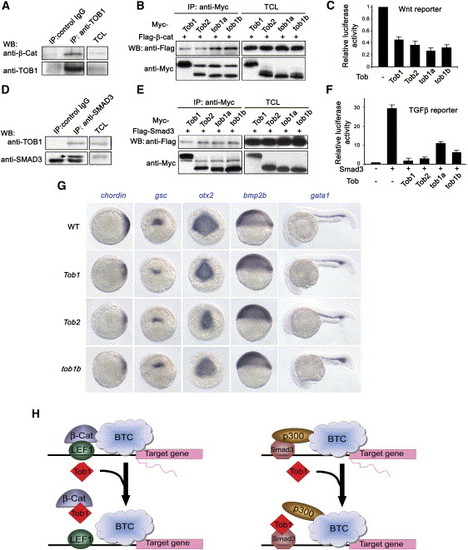
Tob Proteins from Different Species Have Conserved Activity (A) Endogenous β-catenin was associated with TOB1 in human HEK293T cells. Mouse IgG was used as control. (B) Interactions between Flag-tagged β-catenin and different Tob proteins with a Myc tag in HEK293T cells. (C) β-catenin/LEF1-stimulated expression of the LEF1-luciferase reporter was attenuated by coexpression of individual Tob constructs. Data were averaged from three independent experiments and are expressed as means plus standard deviations. (D) Endogenous SMAD3 was associated with TOB1 in human HEK293T cells. Rabbit IgG was used as control. The band representing SMAD3 is indicated by an arrow. (E) Interactions between Flag-tagged Smad3 and different Tob proteins with a Myc tag in HEK293T cells. (F) Smad3-induced expression of the CAGA12-luciferase reporter in Mv1lu cells was suppressed by coexpression of individual Tob constructs. Data were averaged from three independent experiments and are expressed as means plus standard deviations. (G) Embryos injection with 400 pg Tob1, Tob2, or tob1b mRNA showed a decrease of chordin and gsc expression at the shield stage and of otx2 expression at the bud stage, while expression of bmp2b at the shield stage and gata1 at 24 hpf was expanded. Embryos are shown in animal pole views for chordin, in anterodorsal views for otx2, in dorsal views for gsc, and in lateral views for bmp2b and gata1. Corresponding statistical data are shown in Figure S10. (H) Models for antagonizing effects of Tob1 on the transcriptional activities of β-catenin and Smad3. Tob1 binds to β-catenin and precludes β-catenin from binding the coactivator LEF1 (left). Tob1 can also bind to Smad3 and prevents the formation of the Smad3/p300 transcriptional complex (right). BTC, basal transcription complex. |
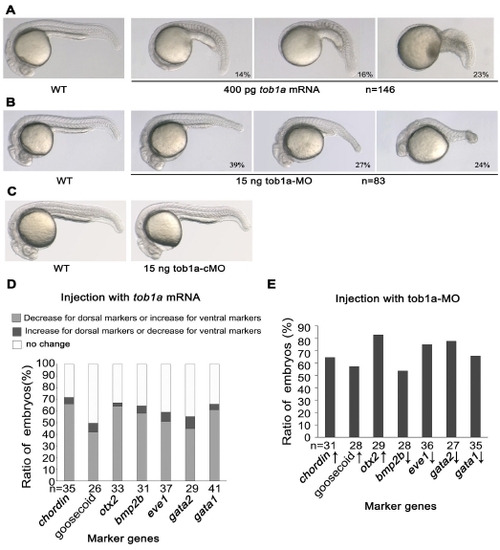
Morphologic and Molecular Changes Caused by tob1a Overexpression and Knockdown (A) Embryos injected with 400 pg of tob1a mRNA were ventralized to variable degrees at 24 hpf. Note the posterior progression of head deletion. (B) Embryos injected with 15 ng of tob1a-MO were dorsalized to variable degrees at 24 hpf. Note the progressive shortening of tail and yolk extension. (C) Embryos injected with 15 ng of tob1a-cMO, a control morpholino that has a sequence identical to tob1a-MO except 6 mismatch nucleotides, did not produce visible phenotypes. (D-E) Ratios of embryos with altered marker gene expression, following injection with tob1a mRNA (D) or tob1a-MO (E). chordin, goosecoid and otx2 are dorsal markers and the others are ventral markers. Downregulation and upregulation were indicated by upward and downward arrowheads in (E), respectively. Corresponding pictures were shown in Figure 2. PHENOTYPE:
|
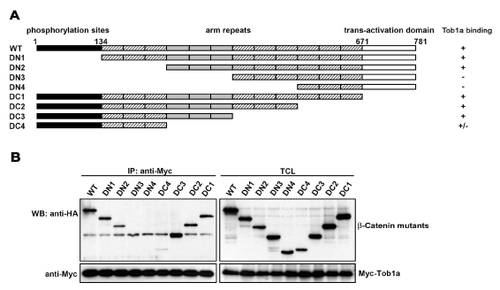
Mapping of β-Catenin Domain Required for Binding Tob1a (A) Schematic draw of β-Catenin domains and deletion mutants. (B) Coimmunoprecipitation results indicated that the 4th-6th Armadillo (arm) repeats of β-Catenin were required for associating with Tob1a. |
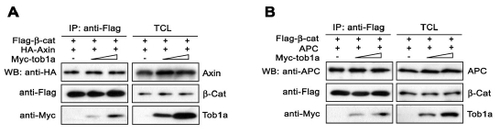
Effect of Tob1a on Formation of β-Catenin/Axin/APC Complexes. The expression plasmids were cotransfected into HEK293T cells, and co-immunoprecipitation was performed. Overexpression of Myc-tob1a had no effect on β-Catenin/Axin (A) or β-Catenin/APC binding (B). Myc-tob1a doses: 1 μg and 3 μg, respectively. |
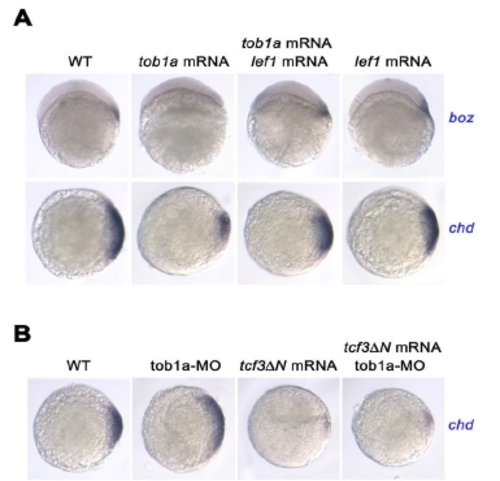
Genetic Interactions between tob1a and lef1, tcf3 (A) Interaction between Tob1a and the β-Catenin coactivator Lef1. Single-cell embryos were injected with 400 pg tob1a mRNA, 300 pg lef1 mRNA or both, and examined for the expression of the dorsal markers bozozok (boz) and chordin (chd). Injection with lef1 mRNA alone caused no obvious changes. Decrease or elimination of boz and chd was seen in 66% (n=32), 61% (n=28) of embryos injected with tob1a mRNA alone, but only in 19% (n=36) and 21% (n=33) of embryos coinjected with tob1a and lef1 mRNA, respectively. This suggests that overexpression of lef1 alleviated inhibitory effect of tob1a overexpression. Upper panel, lateral views with the dorsal to right at the 30% epiboly stage; lower panel, animal-pole views with the dorsal to right at the shield stage. (B) Interaction between Tob1a and the dominant negative form (Tcf3ΔN) of the β-Catenin coactivator Tcf3. Injection with 20 ng tob1a-MO caused an increase of chd in 81% of embryos (n=26). Injection with 200 pg tcf3ΔN mRNA resulted in elimination or decrease of chd expression in 90% of embryos (n=29). When tcf3ΔN mRNA and tob1a-MO were coinjected, 88% (n=33) of embryos still showed a decrease of chd expression. Embryos at the shield stage were animal-pole views with the dorsal to right. EXPRESSION / LABELING:
|
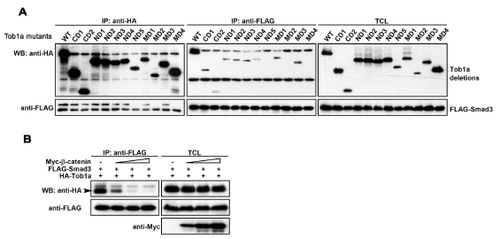
Mapping of Smad3-Binding Domain of Tob1a (A) Reciprocal coimmunoprecipitation between Flag-Smad3 and different Tob1a deletion mutants with HA tag was done in HEK293T cells. Note that Tob1a mutants ND5, MD2 or MD4 failed to coimmunoprecipitate with Flag-Smad3, suggesting that the Box A domain of Tob1a is required for binding Smad3. Schematic draw of Tob1a deletion constructs was shown in Figure 3F. (B) β-Catenin competes with Smad3 for binding Tob1a. Myc-β-Catenin (0, 1, 2 and 5 μg, respectively), Flag-Smad3 (1 μg) and HA-Tob1a (1 μg) were co-transfected into HEK293T cells. Flag-Smad3/HA-Tob1a complexes were immunoprecipitated with anti-Flag antibody and immunoblotted with anti-HA antibody. |
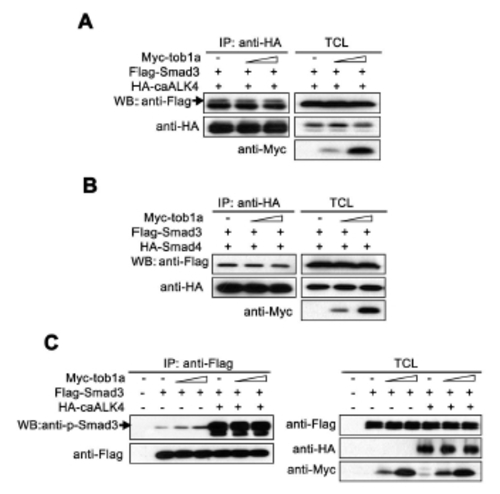
Effect of Tob1a on Biochemical Properties of Smad3 (A) Formation of Flag-Smad3/HA-caALK4 complex (indicated by an arrow) was not affected by coexpression of tob1a (1 μg and 4 μg from left to right) in HEK293T cells. (B) Formation of Flag-Smad3/HA-Smad4 complex was not affected by coexpression of tob1a (1 μg and 4 μg from left to right) in HEK293T cells. (C) The level of phosphorylated Smad3 (indicated by an arrow), which was promoted by coexpression of caALK4, was not affected by coexpression of tob1a (1 μg and 4 μg from left to right) in HEK293T cells. |
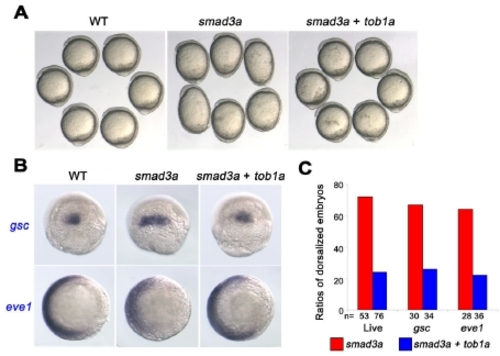
Genetic Interaction between tob1a and smad3a (A) Live embryos at the 5-somite stages. Injection with 50 pg of smad3a mRNA resulted in dorsalized phenotypes, which were counteracted by coinjection with 100 pg of tob1a mRNA. (B) Overexpression of smad3a increased gsc expression and decreased eve1 expression at the shield stage, which were compromised by co-overexpression of tob1a. (C) Statistical data for smad3a and tob1a injections. EXPRESSION / LABELING:
|
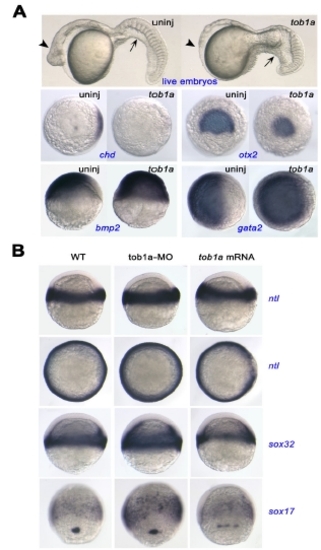
Effects of tob1a in MZoep Mutants and on Mesodermal and Endodermal Markers (A) Effects of tob1a overexpression in MZoep mutants. Injection with tob1a mRNA caused loss of a head (indicated by arrowheads) and expansion of caudal ventral region (indicated by arrows) at 24 hpf (top panel). Orientations of embryos for expression of marker genes (in blue letters): animal-pole views with the dorsal to right) for chordin (chd) and gata2 at the shield stage; dorsoanterior views for otx2 at the bud stage; and lateral views with the dorsal to right for bmp2b at the shield stage. (B) Embryos were injected with 20 ng of tob1a-MO or 400 pg of tob1a mRNA and examined for expression of the mesodermal marker ntl at the shield stage and the endodermal marker sox32 at the shield stage and sox17 at the 75% epiboly stage. The first and the third panels, lateral views with the dorsal to right; the second panel, animal-pole views with the dorsal to right; the fourth panel, dorsal views with the animal-pole to top. |
Reprinted from Developmental Cell, 11(2), Xiong, B., Rui, Y., Zhang, M., Shi, K., Jia, S., Tian, T., Yin, K., Huang, H., Lin, S., Zhao, X., Chen, Y., Chen, Y.G., Lin, S.C., and Meng, A., Tob1 controls dorsal development of zebrafish embryos by antagonizing maternal beta-catenin transcriptional activity, 225-238, Copyright (2006) with permission from Elsevier. Full text @ Dev. Cell