
|
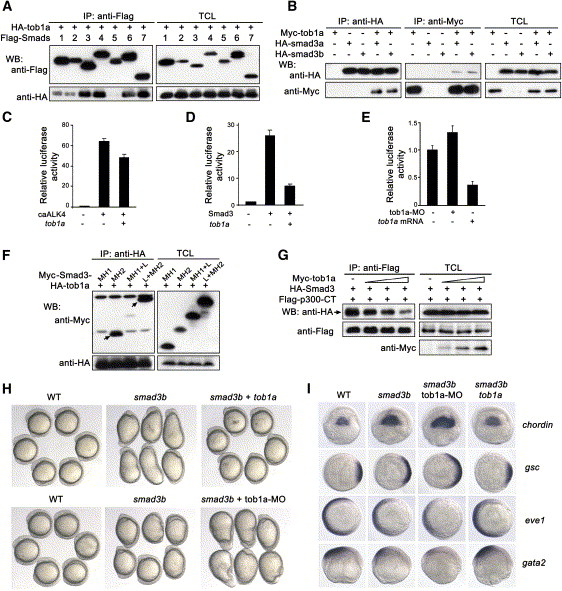
Fig. 6 Tob1a Interacts with Smad3 and Inhibits Its Activity (A) Interactions of Tob1a with different mammalian Smads in HEK293T cells. (B) Zebrafish Tob1a-Smad3a or Tob1a-Smad3b interactions in HEK293T cells. (C) Overexpression of tob1a attenuated caALK4-stimulated expression of the reporter CAGA12-luciferase in Mv1lu cells. Data were averaged from three independent experiments and are expressed as means plus standard deviations. (D) Overexpression of tob1a attenuated Smad3-stimulated CAGA12-luciferase expression in Mv1lu cells. Data were averaged from three independent experiments and are expressed as means plus standard deviations. (E) CAGA12-luciferase expression in zebrafish embryos was inhibited by injecting 400 pg tob1a mRNA, but it was enhanced by injecting 15 ng tob1a-MO. Data were averaged from three independent experiments and are expressed as means plus standard deviations. (F) Mapping of Smad3 domains that are required for binding Tob1a. Note that only the MH2 or the Linker plus MH2 domains was strongly bound to Tob1a (indicated by arrows), while the MH1 plus Linker was weakly bound to Tob1a. (G) Binding of HA-Smad3 to Flag-p300-CT (containing the C-terminal region of p300) was inhibited by coexpression of an increasing amount of tob1a (0.5 μg, 1 μg, and 4 μg) in HEK293T cells. The band for HA-Smad3/Flag-p300-CT complexes is indicated by an arrow. (H) Morphological changes in injected embryos at the 5-somite stage. Embryos injected with 50 pg smad3b mRNA were remarkably elongated (middle, top panel); this phenotype was alleviated by coinjection with 100 pg tob1a mRNA (right, top panel). Injection with 25 pg smad3b mRNA caused a less severe dorsalized phenotype (middle, bottom panel), which was strengthened by coinjection with 15 ng tob1a-MO (right, bottom panel). (I) Changes in expression of marker genes at the shield stage. Injection with 50 pg smad3b resulted in the expansion of expression domains of the dorsal markers chordin and gsc and the reduction of expression of the ventral markers eve1 and gata2. Effects of smad3b overexpression were enhanced by injection with 15 ng tob1-MO, but they were inhibited by injection with 100 pg tob1a mRNA. Embryos are shown in dorsal views with the animal pole oriented toward the top for chordin, in animal pole views with dorsal oriented toward the right for gsc and eve1, or in lateral views with dorsal oriented toward the right for gata2. Corresponding statistical data are shown in Figure S8.
Reprinted from Developmental Cell, 11(2), Xiong, B., Rui, Y., Zhang, M., Shi, K., Jia, S., Tian, T., Yin, K., Huang, H., Lin, S., Zhao, X., Chen, Y., Chen, Y.G., Lin, S.C., and Meng, A., Tob1 controls dorsal development of zebrafish embryos by antagonizing maternal beta-catenin transcriptional activity, 225-238, Copyright (2006) with permission from Elsevier. Full text @ Dev. Cell