
- Title
-
N-cadherin is required for the polarized cell behaviors that drive neurulation in the zebrafish
- Authors
- Hong, E., and Brewster, R.
- Source
- Full text @ Development
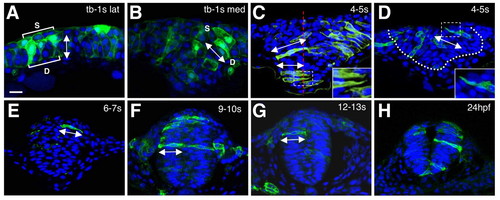
Analysis of cell behaviors in wild-type embryos. (A-H) Cross sections through the anterior neuroepithelium of mGFP (green) and DAPI (blue) labeled embryos. Dorsal is towards the top in all panels; developmental stages are indicated in the upper right corner. C is a composite of multiple focal planes. All other panels are single frames. The insets in C and D are higher magnifications of the boxed in areas. s, superficial cells; d, deep cells; lat, lateral region; med, medial region. Double arrowheads indicate the angular orientation of cells, the dotted red line in C indicates the midline of the neural keel and the dotted white line in D outlines the neural keel. Scale bar: 20 μm. |
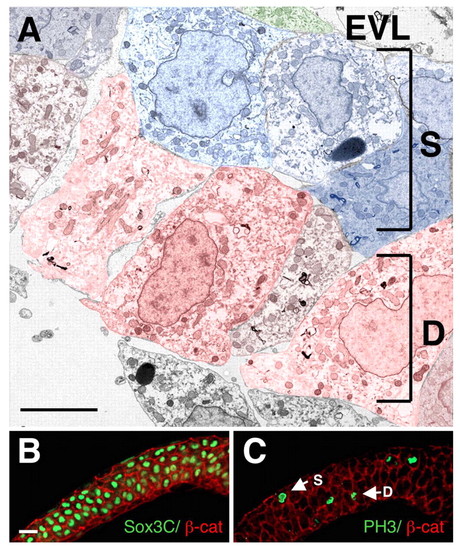
The neural plate is multi-layered. Cross sections through the anterior lateral neural plate at the tailbud-1 som stage; dorsal is towards the top. (A) TEM micrograph, in which superficial cells are pseudocolored in blue, deep cells in red and the EVL in green. (B) Embryo double labeled with α-β-cat (red) and α-Sox3C (green). (C) Embryo double labeled with α-β-cat (red) and α-PH3 (green). Abbreviations are as in Fig. 1. Scale bars: in A, 5 μm; in B, 20 μm for B,C. |
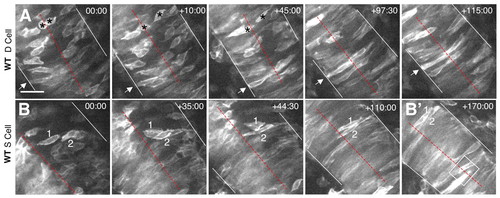
Time-lapse imaging of wild-type cells. (A,B) Selected frames from time-lapse confocal movies are shown for a deep (A) and two superficial (B) cells. Time elapsed (in minutes) from the first frame is indicated in the upper right corner. mGFP-labeled embryos were imaged in the hindbrain region, from a dorsal view, beginning at approximately 2-3 som and extending through 6-7 som. Dotted red lines indicate the midline of the neural keel/rod, white lines mark the edges of the neural keel/tube, arrows and numbers indicate individual cells identified in multiple frames, asterisks in A indicate two daughter cells derived from a recent cell division, and the box in B' shows interdigitation of cells at the midline. Scale bar: 100 μm. |
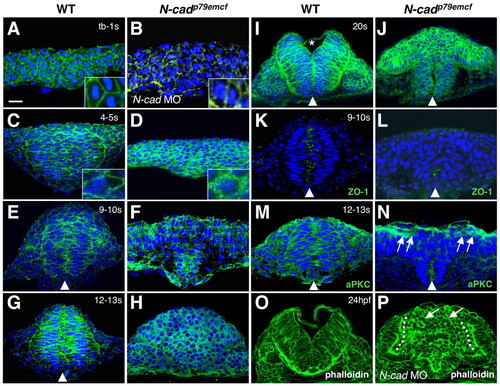
Analysis of junctional marker expression during neurulation. (A-P) Cross sections through the anterior neuroepithelium of wild-type (A,C,E,G,I,K,M,O), N-cad MO-injected (B,P) and N-cadp79emcf mutant (D,F,H,J,L,N) embryos. Developmental stages are indicated in the upper right corner; dorsal is towards the top in all panels. Embryos were labeled with α-β-cat (A-J), α-ZO-1 (K,L), α-aPKC (M,N), DAPI (A-N) and Alexa-488-phalloidin (O,P). Insets in A-D show higher magnifications of cells. Asterisk in I indicates the position of the forming ventricle, arrowheads point to midline apical labeling, arrows in N point to apical α-aPKC labeling, arrows in P show rosettes, and the dotted line in P indicates apical localization of phalloidin. Scale bar: 20 μm. PHENOTYPE:
|
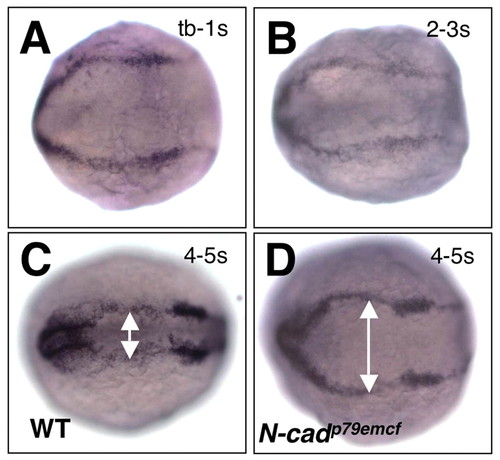
Neural tube morphogenesis is blocked at the neural keel stage in N-cad mutants. (A-D) Dorsal view of embryos labeled by in situ hybridization with a dlx3 riboprobe. Anterior is to the left; developmental stages are indicated in the upper right corner. (A,B) Representative embryos from a cross between two N-cadp79emcf heterozygote parents. (C) Wild-type sibling; (D) N-cadp79emcf mutant. Double arrowheads indicate the width of the dorsal neural rod. EXPRESSION / LABELING:
|
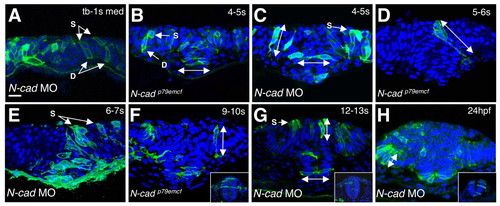
Analysis of cell behaviors in N-cad-depleted embryos. (A-H) Cross sections through the anterior neuroepithelium of mGFP and DAPI-labeled MO-injected (A,C,E,G,H) and mutant (B,D,F) embryos. Dorsal is towards the top in all panels; developmental stages are indicated in the upper right corner. C,D and E are composites of multiple focal planes. All other panels are single frames. The insets in F-H are images of wild-type embryos at comparable stages. Abbreviations and symbols are as in Fig. 1. Scale bar: 20 μm. |
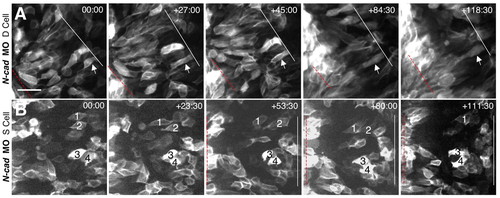
Time-lapse imaging of N-cad-depleted cells. (A,B) Selected frames from time-lapse confocal movies are shown for deep (A) and superficial (B) cells. Time elapsed (in minutes) from the first frame is indicated in the upper right corner. mGFP-labeled embryos were imaged in the hindbrain region, from a dorsal view, beginning at approximately 2-3 som and extending through 6-7 som. Symbols are as in Fig. 4. Scale bar: 100 μm. |
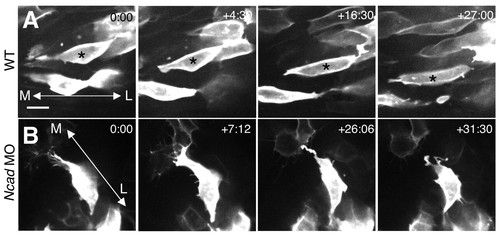
The protrusive activity in N-cad-depleted embryos is unstable. (A,B) Single frames from time-lapse imaging are shown for wild-type (A) and N-cad-depleted (B) superficial cells. Time elapsed (in minutes) from the first frame is indicated in the upper right corner. mGFP-labeled embryos were imaged from a dorsal view, beginning at approximately the 3 som stage and extending through 4-5 som. Asterisks indicate individual cells identified in multiple frames; double arrowheads indicate the orientation of the mediolateral (ML) axis. Scale bar in A: 10 μm. |