
|
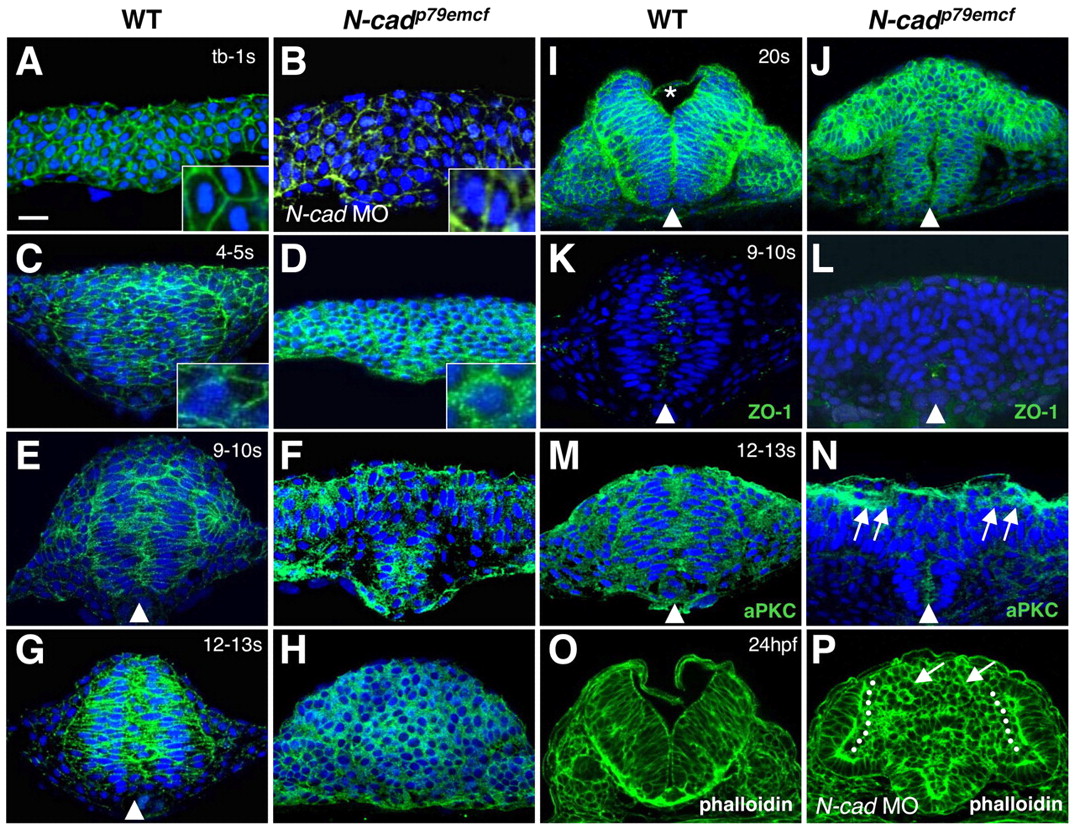
Fig. 4 Analysis of junctional marker expression during neurulation. (A-P) Cross sections through the anterior neuroepithelium of wild-type (A,C,E,G,I,K,M,O), N-cad MO-injected (B,P) and N-cadp79emcf mutant (D,F,H,J,L,N) embryos. Developmental stages are indicated in the upper right corner; dorsal is towards the top in all panels. Embryos were labeled with α-β-cat (A-J), α-ZO-1 (K,L), α-aPKC (M,N), DAPI (A-N) and Alexa-488-phalloidin (O,P). Insets in A-D show higher magnifications of cells. Asterisk in I indicates the position of the forming ventricle, arrowheads point to midline apical labeling, arrows in N point to apical α-aPKC labeling, arrows in P show rosettes, and the dotted line in P indicates apical localization of phalloidin. Scale bar: 20 μm.