
- Title
-
Cloning and expression analysis of cadherin7 in the central nervous system of the embryonic zebrafish
- Authors
- Liu, B., Joel Duff, R., Londraville, R.L., Marrs, J.A., and Liu, Q.
- Source
- Full text @ Gene Expr. Patterns

Deduced amino acid sequence of zebrafish Cdh7. (Abbreviations: cyto, cytoplasmic domain; EC1–EC5, extracellular domains 1–5; Sig, signal sequence; TM, transmembrane domain. |

(A) Amino acid sequence comparison between the deduced zebrafish Cdh7 amino acid sequence (Zcdh7), chicken Cdh7 (Ccdh7), human Cdh7 (Hcdh7), and mouse Cdh7 (Mcdh7). Comparisons were between published sequences from the EC1 to near the end of the coding sequences. Residues that are identical among all four sequences are outlined in black. Residues conserved in three of four sequences are outlined in blue, while two of four outlined in green. (B) Sequence identity percentages for pairwise comparisons between zebrafish Cdh7, several other Cdh7 sequences, cadherin10 (Zcdh10, another type II zebrafish cadherin) and a type I zebrafish cadherin, cadherin1 (Zcdh1). Sequence comparisons were performed using Clustal W (Des Higgins, EBI, Hinxton Hall, UK). |
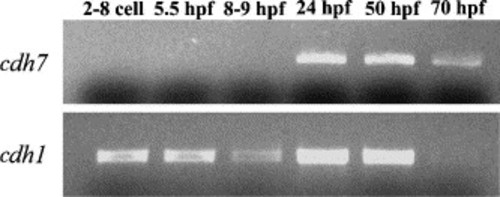
RT-PCR analysis of cdh7 expression in embryonic zebrafish using total RNAs. RT-PCR for cdh1 was performed as loading control. |
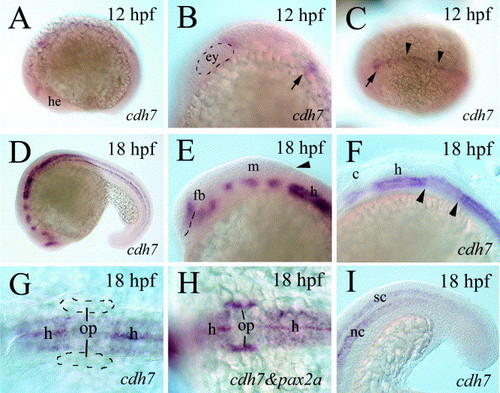
cdh7 expression in 12–18 hpf zebrafish embryos. All panels, except (C, G, and H), show lateral views of whole mount embryos (anterior to the left and dorsal up) labeled with either cdh7 cRNA (A–G and I) or cdh7 and pax2a cRNA probes (H, both probes were digoxigenin-labeled). (B) Higher magnification of the head region of the embryo with the eye primordium outlined by the dashed line. (C) Dorsal view (anterior to the left) of the embryo. The arrows in (B and C) point to the same cdh7 expression region in the hindbrain, while arrowheads in (C) indicate cdh7 expression at the midline. (E–G) Higher magnifications of the head region, while (I) is a higher magnification of the tail region. The dashed line in (E) indicates the optic recess, while the arrowhead points to the caudal boundary of the cerebellum. The pair of arrowheads in (F) bracket a hindbrain region with reduced cdh7 expression. (G and H) Dorsal views (anterior to the left) of higher magnifications of the hindbrain region of the embryos showing that the region with the reduced cdh7 expression is at the level of the otic placode. The otic placodes in (G) are outlined with dashed lines. Abbreviations: c, cerebellum; ey, eye premordium; h, hindbrain; he, head region; nc, notochord; op, otic placode; sp, spinal cord. EXPRESSION / LABELING:
|
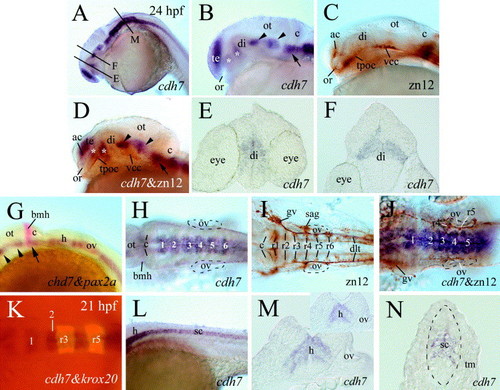
cdh7 expression in 24 hpf zebrafish embryos (K is from 21 hpf). Zebrafish embryos processed for cdh7 whole mount in situ hybridization are shown in (A, B, E, F, H, L–N). (C and I) Embryos processed for zn12 whole mount immunostaining, while (D and J) show embryos processed for double-labeling [cdh7 in situ hybridization (purple) followed by zn12 immunostaining (brown)]. (G) From a double-labeling experiment using digoxigenin-labeled cdh7 (purple) and fluorescein-labeled pax2a (red) cRNA probes. (K) An embryo processed for double-labeling experiment using the digoxigenin-labeled cdh7 probe (dark) and fluorescein-labeled krox20 probe (fluorescent). (A–D and G) Lateral views of the head region with anterior to the left and dorsal up. (E, F, M, and N) Cross sections (dorsal up) from embryos processed for cdh7 whole mount in situ hybridization. Asterisks in (B and D) indicate cdh7 expressing domains in the diencephalon. Arrowheads and arrow (B, D and G) indicate corresponding cdh7 expressing domains in the mid- and hindbrains. The section levels of (E, F, and M) indicated by corresponding letters in (A). (H–K) Dorsal views (anterior to the left) of higher magnification of the hindbrain region. The otic vesicles in (H–J) are outlined by dashed lines. The white numbers in (H, J, and K) label swellings of cdh7 expression in the hindbrain. (M) Section from a swelling in cdh7 expression in the hindbrain at the otic vesicle level, while the inset in (M) shows a section from a restriction in cdh7 expression in a similar region. (L) Lateral view of the mid-trunk region of the embryo. The spinal cord region in (N) is outlined by the dashed line. Abbreviations: ac, anterior commissure; bmh, boundary of the mid- and hindbrains; di, diencephalon; gv, trigeminal ganglion; ot, optic tectum; ov, otic vesicle; r1–r6, rhombomeres 1–6; sag, statoacoustic ganglion; te, telencephalon; tm, trunk muscles; tpoc, tract of postoptic commissure; vcc, ventrocaudal cluster. Other abbreviations are the same as in Fig. 4. EXPRESSION / LABELING:
|
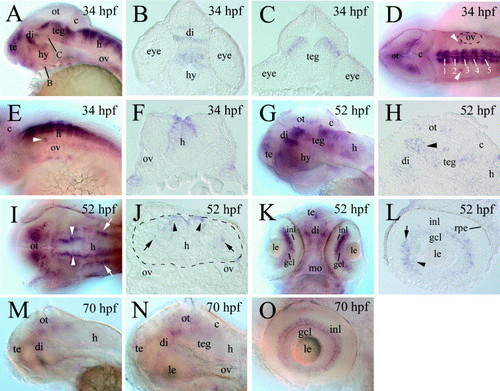
cdh7 expression in 34 hpf (A–F), 52 hpf (G–L), and 70 hpf (M–O) zebrafish embryos. (A, D, E, G, I, K, M–O) From whole mount embryos processed for cdh7 in situ hybridization, while the remaining panels are sections from embryos processed for cdh7 whole mount in situ hybridization. (A, G, M, and N) Lateral views of the head region (anterior to the left and dorsal up). (B and C) Cross sections (dorsal up) of the brain, with their section levels indicated by corresponding letters in (A). (D and I) Dorsal views (anterior to the left), while (E) is a lateral view (anterior to the left and dorsal up) of the hindbrain region. The white numbers in (D) indicate cdh7 expression swellings in the hindbrain. The arrowheads in (D and E) point to a pair of cdh7 expressing cell clusters in the ventral region anterodorsal to the otic vesicle. (F) Cross section (dorsal up) from the hindbrain. (H) Higher magnification of parasagittal section of the midbrain region. The arrowhead indicates cdh7 expressing cells in the pretectal region. The pair of arrowheads in (I) point to the dorsomedially located cdh7 expression domains, while the arrows indicate the ventrolaterally situated expression domains. (J) Cross section (dorsal up) from the hindbrain also showing the same cdh7 expressing domains (indicated by corresponding arrowheads and arrows) as in panel I. The hindbrain boarder in this panel is outlined by the dashed line. Panel K is a ventral view (anterior up) of the forebrain and eyes, while panel L is a parasagittal section (anterior to the left and dorsal up) of the retina. Panel N is a higher magnification of the head region in panel M, while panel O (anterior to the left and dorsal up) shows a lateral view of the eye. Abbreviations: gcl, retinal ganglion cell layer; hy, hypothalamus; inl, inner nuclear layer; mo, mouth; rpe, retinal pigmented epithelium; teg, tegmentum. Other abbreviations are the same as in previous figures. |
Reprinted from Gene expression patterns : GEP, 7(1-2), Liu, B., Joel Duff, R., Londraville, R.L., Marrs, J.A., and Liu, Q., Cloning and expression analysis of cadherin7 in the central nervous system of the embryonic zebrafish, 15-22, Copyright (2007) with permission from Elsevier. Full text @ Gene Expr. Patterns