
Fig. 6
- ID
- ZDB-FIG-070118-18
- Publication
- Liu et al., 2007 - Cloning and expression analysis of cadherin7 in the central nervous system of the embryonic zebrafish
- Other Figures
- All Figure Page
- Back to All Figure Page
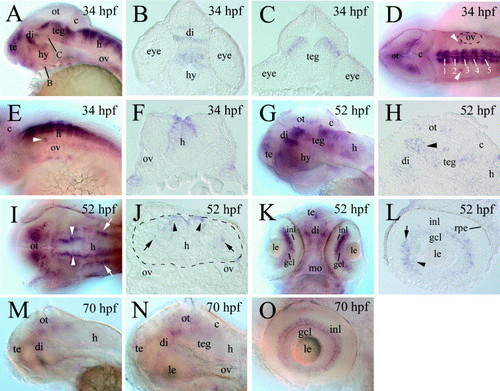
cdh7 expression in 34 hpf (A–F), 52 hpf (G–L), and 70 hpf (M–O) zebrafish embryos. (A, D, E, G, I, K, M–O) From whole mount embryos processed for cdh7 in situ hybridization, while the remaining panels are sections from embryos processed for cdh7 whole mount in situ hybridization. (A, G, M, and N) Lateral views of the head region (anterior to the left and dorsal up). (B and C) Cross sections (dorsal up) of the brain, with their section levels indicated by corresponding letters in (A). (D and I) Dorsal views (anterior to the left), while (E) is a lateral view (anterior to the left and dorsal up) of the hindbrain region. The white numbers in (D) indicate cdh7 expression swellings in the hindbrain. The arrowheads in (D and E) point to a pair of cdh7 expressing cell clusters in the ventral region anterodorsal to the otic vesicle. (F) Cross section (dorsal up) from the hindbrain. (H) Higher magnification of parasagittal section of the midbrain region. The arrowhead indicates cdh7 expressing cells in the pretectal region. The pair of arrowheads in (I) point to the dorsomedially located cdh7 expression domains, while the arrows indicate the ventrolaterally situated expression domains. (J) Cross section (dorsal up) from the hindbrain also showing the same cdh7 expressing domains (indicated by corresponding arrowheads and arrows) as in panel I. The hindbrain boarder in this panel is outlined by the dashed line. Panel K is a ventral view (anterior up) of the forebrain and eyes, while panel L is a parasagittal section (anterior to the left and dorsal up) of the retina. Panel N is a higher magnification of the head region in panel M, while panel O (anterior to the left and dorsal up) shows a lateral view of the eye. Abbreviations: gcl, retinal ganglion cell layer; hy, hypothalamus; inl, inner nuclear layer; mo, mouth; rpe, retinal pigmented epithelium; teg, tegmentum. Other abbreviations are the same as in previous figures. |
| Gene: | |
|---|---|
| Fish: | |
| Anatomical Terms: | |
| Stage Range: | Prim-15 to Pec-fin |
Reprinted from Gene expression patterns : GEP, 7(1-2), Liu, B., Joel Duff, R., Londraville, R.L., Marrs, J.A., and Liu, Q., Cloning and expression analysis of cadherin7 in the central nervous system of the embryonic zebrafish, 15-22, Copyright (2007) with permission from Elsevier. Full text @ Gene Expr. Patterns