
- Title
-
Transient expression of apoaequorin in zebrafish embryos: extending the ability to image calcium transients during later stages of development
- Authors
- Cheung, C.Y., Webb, S.E., Meng, A., and Miller, A.L.
- Source
- Full text @ Int. J. Dev. Biol.

Effect of aeq-mRNA and aeq::EGFP-mRNA on normal development. Embryos were injected with different amounts of aeq-mRNA or aeq::EGFP-mRNA at the 1-cell stage and then observed after 24 h. (A) Bar graph to illustrate the percentage of normal embryos that developed for each amount of mRNA injected. The data are expressed as mean ± SEM (n ≥3). (B) Bright-field images to show the effect of injecting different amounts of aeq-mRNA and aeq::EGFP-mRNA into embryos compared to (i) an uninjected control embryo at 24 hpf. Representative examples of embryos injected with (ii) 500 pg, (iii) 700 pg or (iv) 1500 pg aeq-mRNA, or with (v) 400 pg, (vi) 700 pg or (vii) 1500 pg aeq::EGFP-mRNA. Embryos injected with >700 pg aeq-mRNA or >400 pg aeq::EGFP-mRNA exhibited defects in the development of both head and tail. Scale bar, 200 μm. |
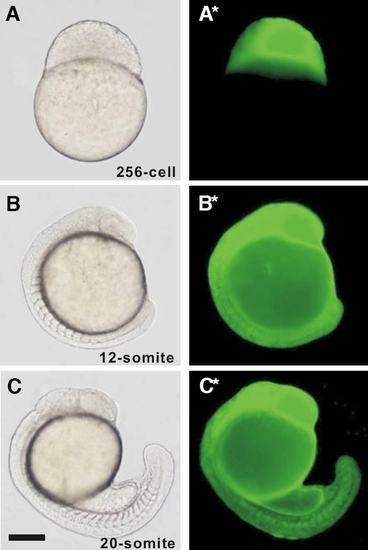
Expression of enhanced green fluorescent protein (EGFP) in the aeq::EGFP-mRNA injected embryos. (A,B,C) Bright-field and (A*,B*,C*) respective EGFP fluorescence images of a representative aeq::EGFP-mRNA injected embryo at the (A, A*) 256-cell, (B, B*) 12-somite and (C, C*) 20-somite stages. Scale bar, 200 μm. |

A comparison of the intracellular Ca2+ signaling patterns observed in representative (A,B) aeq-mRNA injected embryos and (C,D) f-aequorin injected embryos during the Segmentation Period. (A,B) Embryos were injected with aeq-mRNA at the single-cell stage and then bathed with f-coelenterazine to reconstitute aequorin from apoaequorin. (C,D) Embryos were injected into the top of the yolk with f-aequorin during the Cleavage Period. (A,C) are trunk signals observed at ~6-somite stage, during early segmentation, while (B,D) are trunk signals that occur during later segmentation, at ~18 to 20-somite stage. Each panel represents 60 sec of accumulated light. Color scale indicates luminescent flux in photons/pixel. Scale bar, 200 μm. |

The localized intercellular Ca2+ signals that are generated in the trunk of the representative embryo in Fig. 6B are shown in greater detail. This embryo had been injected with aeq-mRNA at the single-cell stage and then bathed with f-coelenterazine to reconstitute aequorin from apoaequorin. Each panel represents 60 sec of aequorin generated light with a 120 s gap between each image. Color scale indicates luminescent flux in photons/pixel. Scale bar, 200 μm. |
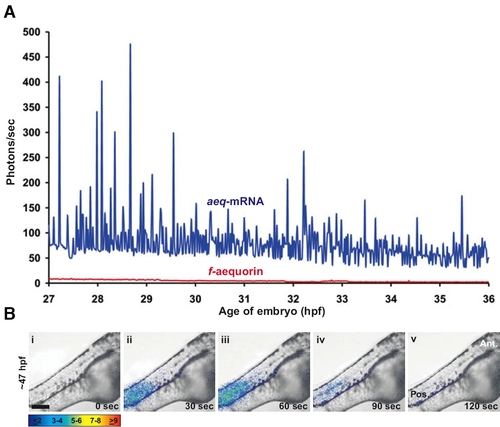
The use of aeq-mRNA extends the aequorin-based Ca2+ imaging window beyond 24 hpf. (A) A comparison of the aequorin-generated luminescence observed in representative aeqmRNA- and f-aequorin-injected embryos from 27-36 hpf. Traces were generated from data points representing 60 sec of luminescence that were acquired every 60 s for an imaging field covering approximately 64,500 pixels. (B) An example of a localized intercellular Ca2+ signal that is generated in the trunk at ~47 hpf. The panels show the representative pattern of luminescence superimposed on corresponding bright-field images. Each panel displays 60 s of accumulated light with a 30 s interval between each image. Ant. and Pos. represent anterior and posterior, respectively. Color scale indicates luminescent flux in photons/pixel. Scale bar, 200 μm. |