
Image
|
Figure Caption
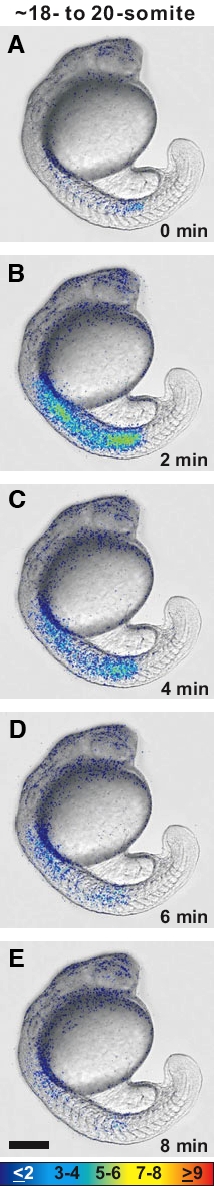
Fig. 7 The localized intercellular Ca2+ signals that are generated in the trunk of the representative embryo in Fig. 6B are shown in greater detail. This embryo had been injected with aeq-mRNA at the single-cell stage and then bathed with f-coelenterazine to reconstitute aequorin from apoaequorin. Each panel represents 60 sec of aequorin generated light with a 120 s gap between each image. Color scale indicates luminescent flux in photons/pixel. Scale bar, 200 μm.
Acknowledgments
This image is the copyrighted work of the attributed author or publisher, and
ZFIN has permission only to display this image to its users.
Additional permissions should be obtained from the applicable author or publisher of the image.
Full text @ Int. J. Dev. Biol.