
- Title
-
Her5 acts as a prepattern factor that blocks neurogenin1 and coe2 expression upstream of Notch to inhibit neurogenesis at the midbrain-hindbrain boundary
- Authors
- Geling, A., Plessy, C., Rastegar, S., Strähle, U., and Bally-Cuif, L.
- Source
- Full text @ Development
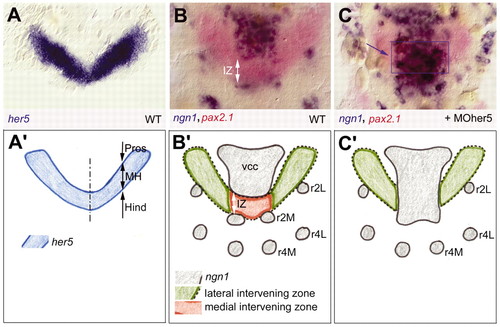
Her5 activity at the midbrain-hindbrain boundary and nomenclature. All top views (A-C) are flat-mounted embryos at the three-somite stage, dorsal views with anterior upwards, revealed by in situ hybridisation for expression of the genes indicated (colour-coded, left corner) (see also Geling et al., 2003). Bottom panels (A2-C2) are interpretative drawings of the embryos in A-C to introduce the specific nomenclature used in this work. At the three-somite stage, her5 expression (A) encompasses most of the presumptive MH (Tallafuss and Bally-Cuif, 2003) and separates the first ngn1-positive clusters (B) within the anterior neural plate. These are the ventrocaudal cluster (vcc), located in the basal diencephalon and anterior midbrain, the presumptive motoneurons (r2M) and lateral neuronal precursors (r2L) in rhombomere 2. The non-neurogenic domain identified by her5 positivity and ngn1 negativity around the MHB is called intervening zone (IZ) (white arrow in B,B2). (C) Upon blocking Her5 activity by injection of a her5 morpholino (MOher5) into wild-type embryos, the medial (future basal) part of the IZ domain is bridged by ectopic ngn1-positive cells (blue arrow and blue box in C, compare with B). Thus, the IZ is composed of a medial domain (red in B2, absent in C2, blue box in C) that crucially requires Her5, and of a lateral domain (green in B2 and C2) that exhibits additional blocks towards neurogenesis. Interpreted from (Geling et al., 2003). Hind, presumptive hindbrain; MH, mid-hindbrain domain; Pros, presumptive prosencephalon; r4M, motorneurons of rhombomere 4; r4L, lateral neuronal precursors in r4. |
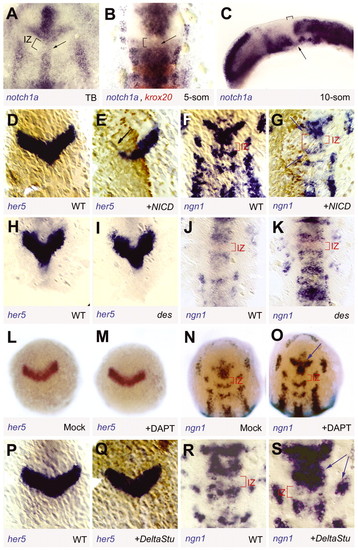
her5 expression and activity at the MH junction are independent of Notch signalling. (A-C) Expression of notch1a (Bierkamp and Campos-Ortega, 1993) revealed by whole-mount in situ hybridisation (blue staining) in wild-type embryos at the stages indicated (bottom right). (A,B) Flat-mounted views of the MH area, anterior towards the top; (C) lateral view, anterior leftwards. In B, double staining for krox20 expression (red) identifies rhombomeres 3 and 5. Note the faint expression of notch1a (arrow) at the ventral midline of the IZ (bracket) at all stages. (D-S) Expression of her5 and ngn1 as indicated (bottom line) in three- to five-somite wild-type (D,F,H,J,P,R) or mock-treated embryos (L,N) versus: (E,G) embryos injected at the two-cell stage with nicd-myc RNA; (I,K) deadly-seven (des) notch1a-deficient mutants; (M,O) embryos treated with the gamma-secretase inhibitor DAPT; and (Q,S) embryos injected in at the two-cell stage with DeltaStu mRNA. All views are dorsal, anterior towards the top; in D-G and Q lineage tracers (Myc and β-galactosidase, respectively) are revealed in brown by immunocytochemistry. NICD inhibits her5 expression and decreases the number of neurons per proneural cluster (arrows in G). All other manipulated or mutant contexts increase this number (e.g. compare the intensity of ngn1 staining between control and experimental embryo in the vcc in K,O,S with J,N,R, arrows); however, none of these manipulations affects her5 expression or the presence and size of the IZ (I,M,Q). des, homozygote deadly-seven embryos; IZ, intervening zone; NICD, Notch intracellular domain; som, somite stage. |
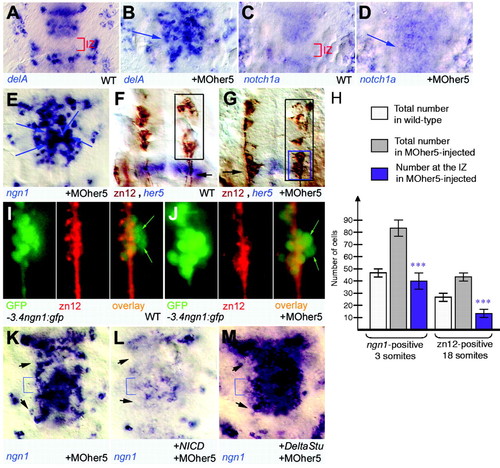
Her5 acts by blocking the formation of a proneural cluster across the IZ. (A-D) Expression of components of the lateral inhibition machinery (e.g. delA, notch1a) is induced across the IZ upon injection of MOher5 (B,D, arrows) compared with non-injected controls (A,C) (brackets indicate IZ). All views are whole-mount in situ hybridisation for the markers indicated (bottom left), dorsal views of the MH area in flat-mounted embryos at the three-somite stage. (E-G) Induced expression of ngn1 across the IZ upon injection of MOher5 (arrows in E) exhibits at the three-somite stage a salt-and-pepper pattern similar to that of anterior (vcc) or posterior (r2) proneural clusters. This is followed by the development, at the 18-somite stage, of zn12-positive differentiated neurons across the IZ (G, compare with F; brown immunocytochemistry staining). Arrow in F indicates the IZ, which is labelled in blue for her5 expression. (Geling et al., 2003). (H) The number of ectopic zn12-positive neurons (right panel) differentiating across the IZ in the absence of Her5 activity [G, blue box (calculated as black box in G minus black box in F)] is lower than the number of ngn1-positive cells (left panel) initially induced across the IZ at the three-somite stage (Fig. 1C, blue box). (I,J) Fate of MH cells expressing ngn1 at the onset of neurogenesis in wild-type embryos (I) and across the IZ in MOher5-injected embryos (J). Descendants of early ngn1-positive cells are revealed by their retention of GFP protein at the 20-somites stage in the –3.4ngn1:gfp transgenic line (green staining), while differentiated neurons are positive for the zn12 antigen (red staining). Note in the overlay (right panels) that several green cells are negative for zn12 in both cases (green arrows). (K-M) The ngn1-positive domain induced across the IZ in the absence of Her5 activity is sensitive to lateral inhibition. The number of strongly ngn1-positive cells in the IZ (brackets) at the three-somite stage, induced by lack of Her5 expression, is reduced upon forced expression of NICD (L, compare with K) and increased upon expression of DeltaStu (M, compare with K). It follows similar dynamics as ngn1 expression in adjacent anterior (vcc) and posterior (r2) proneural clusters (arrowheads). |
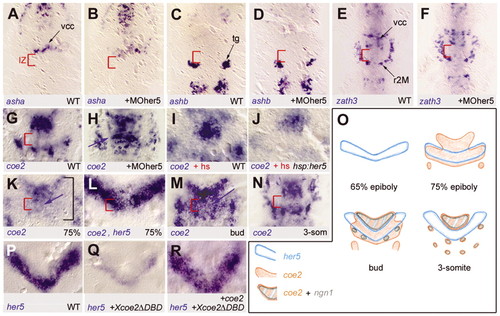
coe2 expression, but not that of asha, ashb and neurod4, is an additional target of Her5 activity at the IZ. Whole-mount in situ hybridisation (except O); dorsal views of the MH area in flat-mounted embryos at the three-somite stage (A-J,N-R), tail bud (M) or 75% epiboly (K,L); anterior towards the top; the markers indicated bottom left; red bracket indicates the IZ. (A-H) Comparison of asha (A,B), ashb (C,D), neurod4 (zath3 in figure) (E,F) and coe2 (G,H) expression upon loss of Her5 activity (B,D,F,H) compared with wild-type siblings (A,C,E,G). coe2 expression is the only target solely repressed by Her5 across the medial IZ (H, blue arrow indicates coe2 induction). (I,J) Comparison of coe2 expression in a pzhsp70:her5 transgenic embryo (J) compared with non-transgenic sibling (I) upon heat-shock (hs) of both embryos at late gastrulation. Note that coe2 expression is repressed upon ectopic her5 expression (weaker staining in J). (K-O) Time-course of her5 and coe2 expression. coe2 expression is initiated at 75% epiboly, thus following her5, across the entire MH area (K, black bracket). Double staining for coe2 and her5 at 75% epiboly (L, both in blue) demonstrates that expression of coe2 and her5 are overlapping across the IZ. coe2 expression is maintained at the IZ until the bud stage (M, blue arrow). Later on, coe2 expression is cleared from the IZ and becomes similar to ngn1 (see O). (P-R) her5 expression at the tail-bud stage in embryos injected with capped RNA encoding a dominant-negative form of Coe2 (Dubois et al., 1998) (Q) compared with non-injected siblings (P) demonstrates strong downregulation of her5 expression when Coe2 activity is impaired. This phenotype is rescued upon coinjection of wild-type coe2 RNA (R). IZ, intervening zone; hs, embryo submitted to a 1 hour heat-shock pulse at late gastrulation; r2M, presumptive motorneurons of rhombomere 2; tg, presumptive trigeminal ganglia; vcc, ventrocaudal cluster. |
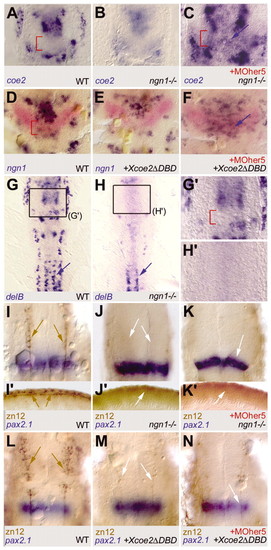
ngn1 and coe2 expression are independently inhibited by Her5, but downregulation of one of these targets is sufficient to prevent neuronal differentiation at the IZ. Expression of coe2 (A-C), ngn1 (D-F), delB (G-H2), pax2.1 and zn12 (I-N) in wild type (A,D,G,I,I2,L), ngn1-/- mutants (B,C,H,H2,J,K) or embryos injected with capped RNA encoding a dominant-negative form of Coe2 (Xcoe2µDBD) (E,F,M,N). Embryos injected with MOher5 (C,F,K,N) are compared with non-injected controls. All views (except I2-K2) are flat-mounted embryos, anterior towards the top, at three somites (A-F), eight somites (G-H2) or 18 somites (I-N). (I2-K2) Lateral views of the tail area of embryos in I-N, anterior leftwards; (G2,H2) high-magnification views of the areas boxed in G,H, respectively; red brackets indicate the IZ. (A-C) coe2 expression in the vcc and r2 is lower in ngn1-/- mutants (B) but still induced at the IZ in the absence of Her5 (C, blue arrow). C is a higher magnification of the IZ area compared with A and B. (D-F) ngn1 expression is lower in the vcc and r2 when Coe2 activity is reduced, but still induced at the IZ (labelled in red by pax2.1) in the absence of Her5 (F, blue arrow). (G-H2) Progression of neurogenesis, as revealed by the commitment marker delB, is fully impaired in the MH area in the absence of Ngn1 (see G2,H2). This contrasts with the maintenance of neurogenesis in spinal motorneurons (blue arrows) (Cornell and Eisen, 2002). (I-K2) In ngn1-/- mutants (identified by their lack of sensory neurons in the spinal cord, compare J2, K2 and I2, arrows), neuronal differentiation in the MH, revealed by zn12 immunocytochemistry, is fully blocked (brown staining and brown arrows in I, white arrows to the absence of staining in J). In addition, in the absence of Her5, neuronal differentiation at the IZ (blue pax2.1 staining) does not take place (white arrow in K). (L-N) Neuronal differentiation within the MH (brown staining and brown arrows in L) is also impaired in the absence of Coe2 function (white arrows in M), and does not take place at the IZ when Her5 activity is blocked (white arrow in N). |
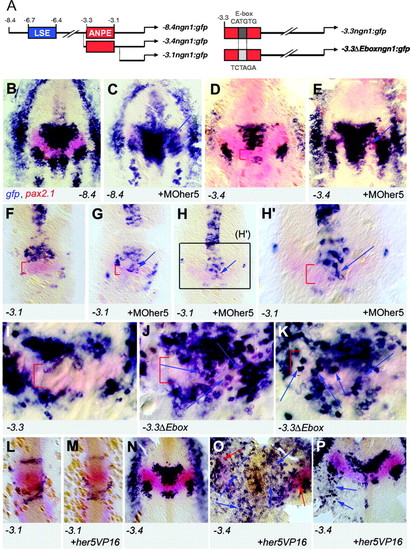
An E-box contained within the ANPE element of the ngn1 gene is the major Her5 response element. (A) ngn1 transgenic reporter lines (left panel) (Blader et al., 2003) and reporter constructs used in transient assays (right panel) used to locate the response elements to Her5 within the ngn1 enhancer. (B-H2) Expression of gfp (revealed by in situ hybridisation, blue staining) and pax2.1 (red staining, used to located the IZ) in the following transgenic lines: –8.4ngn1:gfp (B,C),– 3.4ngn1:gfp (D,E), –3.1ngn1:gfp (F-H2) upon injection of MOher5 (C,E,G-H2) or in non-injected siblings (B,D,F). All panels are flat-mounted embryos, anterior towards the top, at the three-somite (B-E) and eight-somite (F-H2) stages; red brackets indicate the IZ. Two different embryos are shown for injection in the –3.1 line (G,H); H2 is a highly magnified view of the area boxed in H. Note that gfp expression is strongly induced across the IZ upon block of Her5 activity in the –8.4 and –3.4 lines, in a manner similar to endogenous ngn1 expression, but that the response of the –3.1 transgene is minor and restricted to a few cells at the ventral midline. (I-K) Expression of gfp (blue) and pax2.1 (red) in founder embryos injected with –3.3ngn1:gfp (I) and –3.3 Eboxngn1:gfp (J,K, two different embryos are shown). Both constructs carry SceI sites at their extremities and were co-injected with the meganuclease enzyme to trigger early integration (Thermes et al., 2002). Note the large number of ectopic gfp-positive cells in the entire medial IZ domain in embryos expressing the mutated construct without blocking Her5 activity, demonstrating that the E-box located within the ANPE is the major element mediating ngn1 repression at the IZ in vivo. (L-P) Expression of gfp (blue) and pax2.1 (red) in transgenic embryos (lines indicated bottom left). Uninjected embryos (L,N); embryos injected with her5VP16 capped RNA (M,O,P). Embryos are observed at the eight-somite (L,M) and one-somite (N-P) stage. Note that gfp expression in –3.1ngn1:gfp embryos is unperturbed by Her5VP16 (M), while ectopic expression is evident in –3.4ngn1:gfp embryos (two examples shown in O,P, blue arrows indicate ectopic gfp-positive cells, red arrows indicate pax2.1 expression in O). |