
- Title
-
Duplicate mitf genes in zebrafish: complementary expression and conservation of melanogenic potential
- Authors
- Lister, J., Close, J., and Raible, D.
- Source
- Full text @ Dev. Biol.
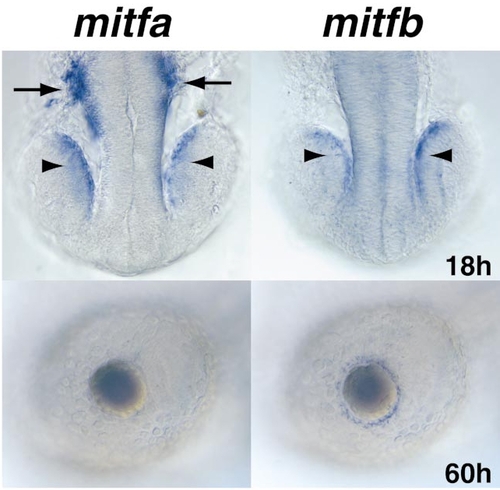
Expression of mitfb during eye development. (Top) 18 somite stage. Both mitfa and mitfb are expressed in the RPE (arrowheads) but only mitfa is expressed in neural crest (arrows). (Bottom) 60 hpf. At this stage, mitfa expression is no longer detectable in the eye; however, mitfb transcripts are present in cells at the retinal margin. Anterior is to the left. EXPRESSION / LABELING:
|
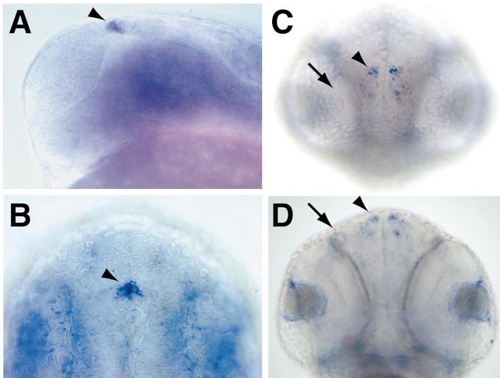
Expression of mitfb in nonpigment cells. (A) 24 hpf, lateral view; (B) dorsal view. Expression of mitfb in the epiphysis (arrowheads). (C) 48 hpf, frontal view; (D) 48 hpf, ventral view. mitfb is detected in symmetrical clusters of cells in the olfactory bulbs (arrowheads; arrows indicate olfactory organ). |
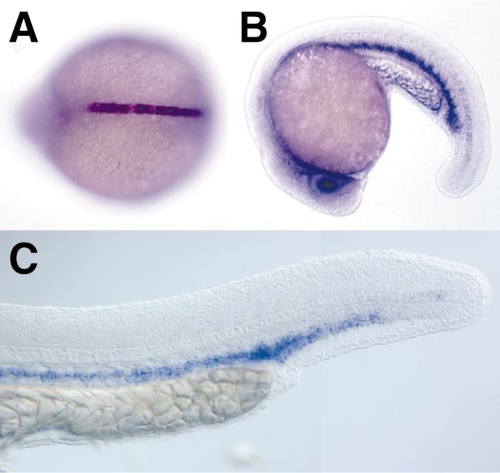
Expression of tfe3a during embryogenesis. (A) 12 somite stage, dorsal view. tfe3a is first strongly expressed in the notochord. (B) 20 somite stage. Notochord expression of tfe3a diminishes rostrally and expression becomes evident in ventral mesoderm and lens. (C) 24 hpf. Expression of tfe3a through much of the ventral mesoderm. EXPRESSION / LABELING:
|
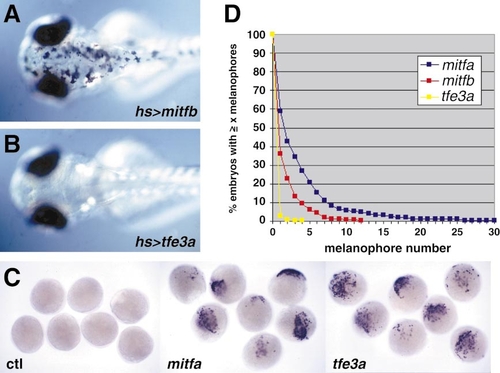
mitfb, but not tfe3a, effectively rescues melanophore development in mitfa mutants. (A, B) Examples of 60-hpf larvae expressing ectopic MiTs under control of the heat shock promoter. mitfb (A) but not tfe3a (B) efficiently restores differentiation of melanophores. A total of 36 out of 143 mitfb-injected embryos had at least one rescued melanophore compared to a single tfe3a-injected embryo with a single melanophore out of 73 injected. (C) Embryos injected with M5-fos:GFP plasmid and the indicated messenger RNA were processed at 8 hpf for in situ hybridization for GFP RNA. mitfa (middle) and tfe3a (right) are each able to transactivate the M-box reporter plasmid in this context. (D) Quantitation of rescue activity by injection of pNP-MiT constructs. Shown on the y-axis are the percentage of injected embryos with an equal or greater number of melanophores as are indicated on the x-axis. mitfa and mitfb both display rescue, but mitfa is somewhat more efficient. Differences between mitfa and mitfb and mitfa and tfe3a are significant as assessed by both the Mann–Whitney U test (P < 0.0001) and Kruskal–Wallis test (P < 0.0001). n = 425 for mitfa, 420 for mitfb, and 379 for tfe3a. No rescue was observed with injection of pNP-mitfa-b692 (n = 235). |
Reprinted from Developmental Biology, 237(2), Lister, J., Close, J., and Raible, D., Duplicate mitf genes in zebrafish: complementary expression and conservation of melanogenic potential, 333-344, Copyright (2001) with permission from Elsevier. Full text @ Dev. Biol.