
- Title
-
Expression of Otx homeodomain proteins induces cell aggregation in developing zebrafish embryos
- Authors
- Bellipanni, G., Murakami, T., Doerre, O.G., Andermann, P., and Weinberg, E.S.
- Source
- Full text @ Dev. Biol.
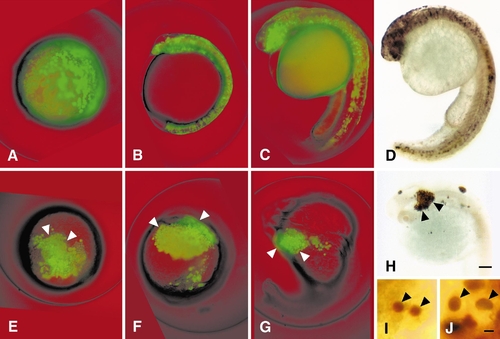
Ectopic zOtx1 expression causes cell aggregation. Embryos were co-injected with GFP RNA and an RNA encoding zOtx1-ΔH (A–C) or zOtx1-wt (E–G) or injected with single RNAs encoding myc-zOtx1-ΔH (D, I) or myc-zOtx1-wt (H, J). The two illustrated co-injected embryos were each examined at 8 hpf (A, E), at 12 hpf(B, F), and again at 24 hpf (C, G). The embryos expressing the Myc-tagged zOtx1 proteins were histochemically stained after fixation at 24 hpf. Higher magnification views of 12-hpf embryos injected with myc-zOtx1-ΔH (I) or myc-zOtx1-wt (J) indicate that the expressed proteins are predominantly localized in nuclei (arrowheads). Nuclei in cells located within the trunk, as in (I), are smaller than nuclei in cells located on yolk or embryo surface, as in (J). Extensive cell aggregation of descendants of injected cells can be seen in those embryos which received zOtx-wt RNAs (arrowheads in E–H) but not in embryos injected with zOtx1-ΔH RNAs. All embryos are shown in lateral view with anterior to the top except in (A), which is an animal pole view. Scale bars, 100 μm (A–H, at same magnification) or 5 μm (I and J, at same magnification). |

Injected ectopically located zOtx1 RNA and endogenous zOtx1 RNA are present at similar levels in embryos showing aggregation of descendants of injected cells. Embryos were injected into 1 cell of a 16-cell embryo with approximately 1 nl of solution containing 100 μg/ml zOtx1 RNA, allowed to develop to 9 hpf, and then fixed and processed for in situ hybridization with zOtx1 probe. The embryos are shown in dorsolateral view with animal pole toward the top. Endogenous zOtx1 is expressed in a mass of cells near the animal pole (dark arrowheads), whereas cells contaning injected ectopically located zOtx1 RNA are present in aggregates located outside of the region of endogenous expresson (open arrowheads). The intensity of in situ hybridization signal in these aggregates is similar to that of the region containing endogenous zOtx1 RNA. |
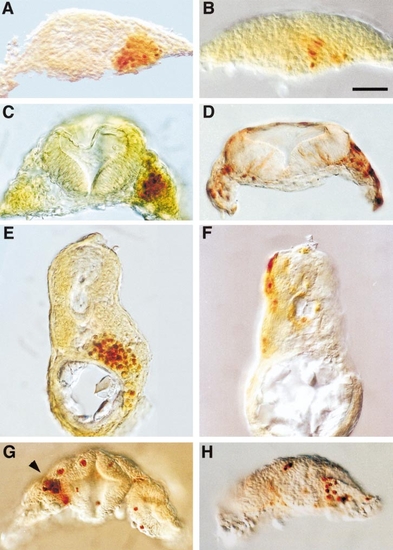
Appearance of zOtx1-induced cell aggregates. Embryos were injected with myc-zOtx1-wt (A, C, E) or myc-zOtx1-ΔH (B, D, F) into one blastomere of a 16-cell embryo or with myc-zOtx1-wt into one blastomere of a 32-cell embryo (G, H) as in Fig. 5. Embryos were allowed to develop to 14 hpf (A, B) or 24 hpf (C–H), processed for immunohistochemical localization of myc epitope, and hand-cut to obtain transverse sections. myc-Otx1-wt, but not myc-zOtx1-ΔH, induces aggregates in the prospective 14-hpf hindbrain region (A, B), in the mesenchyme flanking rhombomere 3 of a 24-hpf embryo (C, D), and in the midtrunk gut region of a 24-hpf embryo (E, F). In (E) only scattered mesenchymal cells stain positively for myc epitope—the brownish color is due to staining of nonadjacent cells at a deeper layer of the section. In midbrain (G) and forebrain regions (H) of embryos injected with myc-zOtx1 RNA, individual cells or small aggregates of cells are found to express the protein. The section shown in (G) has been obliquely cut through the midbrain so that the most posterior portion of the left neural retina and a more anterior portion of the right neural retina are included. A small aggregate of myc-zOtx1- expressing cells is found in the medial posterior portion of the left neural retina (arrowhead), whereas scattered expressing cells are found in the right neural retina. The section shown in (H) is cut through the telencephalon of another embryo. Scale bar, 50 μm (all at same magnification). |
zOtx1-induced cell aggregates are compatible with the formation of anterior brain regions. To restrict the cell aggregates to a smaller region of the gastrulating embryo, embryos were injected with zOtx1-wt RNA plus GFP RNA into a single nonmarginal, noncentral cell at the 32-cell stage. A single embryo is shown here at 9 (A, B), 12 (C, D), and 24 (E, F) hpf in lateral (A, C, E) and dorsal (B, D, F) views. Descendants of the injected cell in this embryo remain within the prospective anterior brain at 9 hpf, in the developing head region at 12 hpf, and mostly become part of the diencephalon and neural retina at 24 hpf. Arrowheads point to cell aggregates, and for the 24-hpf embryos, to groups of cells located in the forebrain, midbrain, and neural retina. Scale bar, 100 μm (all at same magnification). |
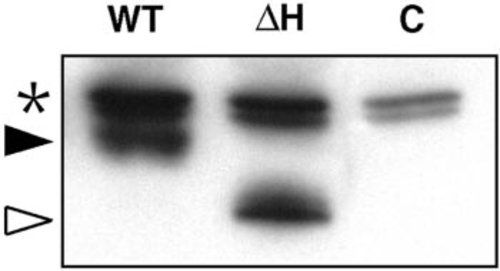
Equivalent levels of Myc-tagged protein are made in embryos injected with RNAs encoding wild-type and homeodomain- deficient myc-zOtx1 RNAs. An SDS–PAGE gel on which was run extract from the equivalent of two embryos injected with myc-zOtx1-wt RNA (WT) or myc-zOtx1-ΔH RNA (ΔH), or that were uninjected (C), was Western blotted as described under Materials and Methods. Bands indicated with an asterisk are endogenous proteins recognized by the anti-mouse Ig second antibody and serve as a loading control. The position of the myczOtx- wt protein is indicated by a black arrowhead, that of the myc-zOtx1-ΔH protein by an open arrowhead. The protein made by embryos injected with myc-zOtx1-wt or myc-zOtx1-ΔH RNAs each ran with mobilities 21 kDa higher than expected, as did proteins made from these RNAs by coupled in vitro transcription and translation (using the TnT coupled reticulocyte lysate system; Promega), indicating a consistent anomalous mobility of myczOtx1 proteins in the SDS–PAGE system. In this experiment, myc-zOtx1-wt and myc-zOtx1-ΔH RNAs that had been used for the injections in Table 1 were also each injected at the 1- to 8-cell stage and samples were prepared from these embryos at the 100% epiboly stage for immunoblotting. Similar equivalence has been shown for embryos injected into 1 cell at the 16-cell stage and allowed to develop to 14 hpf. |
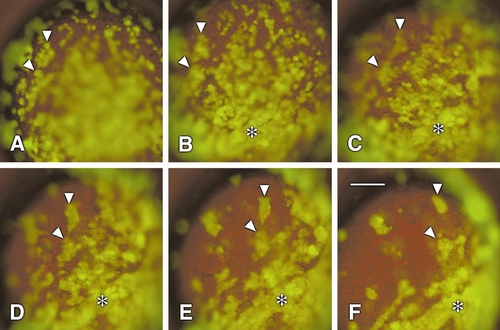
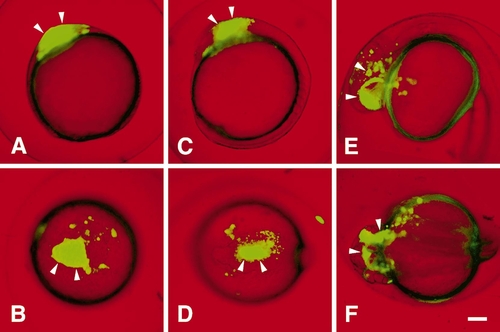
Ectopic zOtx1-GR expression causes cell adhesion when activated with dexamethasone. Embryos were co-injected at the 16-cell stage with GFP and zOtx1-GR RNAs and allowed to develop until 8 hpf at which time dexamethasone was added to the embryo medium at a final concentration of 20 μm. The positions of fluorescent cells in these embryos were then followed over the next 5.25 h. The images show the time course of a single embryo photographed at 9.5 (A), 10.25 (B), 11.0 (C), 11.75 (D), 12.5 (E), and 13.25 (F) hpf. Small islets of loose aggregates were formed from dispersed fluorescent cells in the first 2 h after dexamethasone activation (A, B). Later, the aggregates merged into larger arrays of cells that showed a more tightly packed organization (C–F). The embryo is shown in lateral view with animal pole to the top and dorsal side to the right. Time lapse studies of six embryos examined during this interval all showed a similar time course of the activation of aggregation. Some of the aggregates and cells from which they were formed are indicated with arrowheads and asterisks. Rates of convergence of the aggregates (see text) were determined from positions at 11.75 and 12.5 hpf. Scale bar, 100 μm (all at same magnification). |
Reprinted from Developmental Biology, 223(2), Bellipanni, G., Murakami, T., Doerre, O.G., Andermann, P., and Weinberg, E.S., Expression of Otx homeodomain proteins induces cell aggregation in developing zebrafish embryos, 339-353, Copyright (2000) with permission from Elsevier. Full text @ Dev. Biol.