
- Title
-
A role for DNA methylation in gastrulation and somite patterning
- Authors
- Martin, C.C., Laforest, L., Akimenko, M.-A., and Ekker, M.
- Source
- Full text @ Dev. Biol.
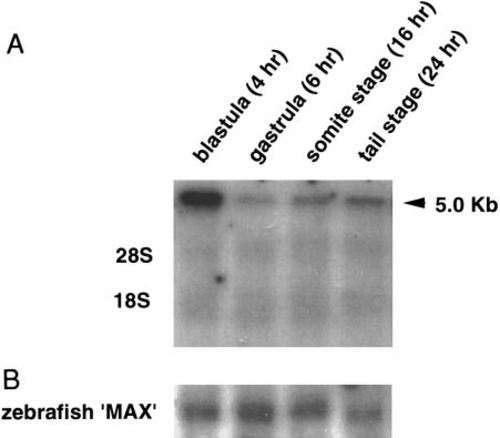
Northern blot of blastula-stage (4 h), gastrula-stage (6 h), somite-stage (16 h), and tail-stage (24 h) zebrafish embryo total RNA (20 μg) hybridized to (A) the zebrafish DNA (cytosine-5) methyltransferase (MTase) cDNA or (B) the zebrafish Max cDNA. The zebrafish “Max” gene expression is relatively uniform throughout early development (Schreiber-Agus et al., 1994). |
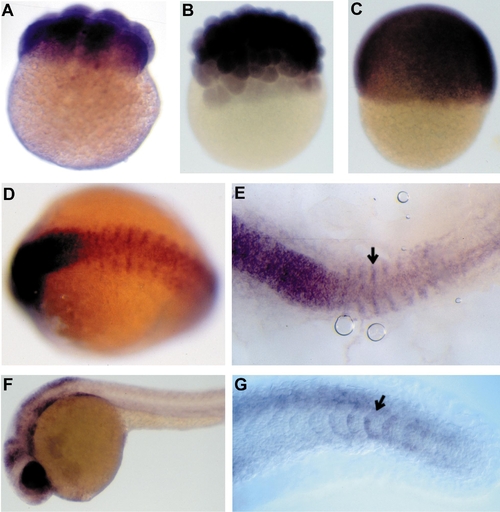
Expression of DNA (cytosine-5) methyltransferase in zebrafish embryos. Whole mount in situ hybridization of (A) 8-cell-stage, (B) blastula-stage (3 h), (C) 6 h gastrula-stage, (D, E) 13-h somite-stage and (F, G) 24-h zebrafish embryos with a zebrafish MTase antisense RNA probe. Arrows in E and G indicate the anterior and posterior differentiating somites, respectively. Scale bar: A–D, 135 μm; E, 95 μm; F, 200 μm; G, 50 μm. |
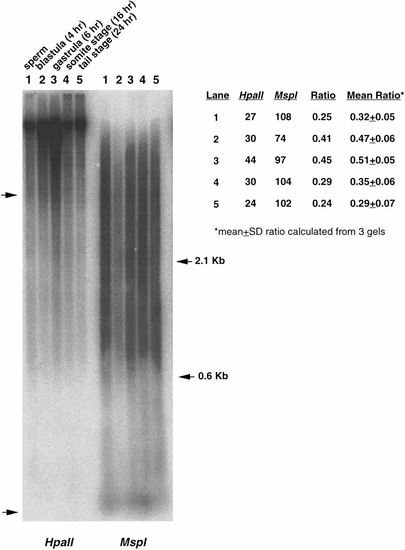
Global changes in DNA methylation during early zebrafish development. DNA collected from sperm, blastula stage (4 h), gastrula-stage embryos (6 h), somite-stage embryos (16 h), and 24-h embryos were digested with HpaII or MspI, and hybridized to the zebrafish interspersed repetitive sequence DANA/mermaid. Densitometric scans were performed in regions of the gel corresponding to low- and mid-molecular-weight DNA restriction fragments (region between left arrows). Mean density values (indicated here for this particular gel) were used to produce a comparative density ratio between the corresponding HpaII and MspI lanes. A high ratio indicates low levels of DNA methylation (i.e., high similarity between the densities of HpaII and MspI lanes) and low ratio indicates higher levels of DNA methylation. Ratios are indicated as the average of three independent gels ± SD. |
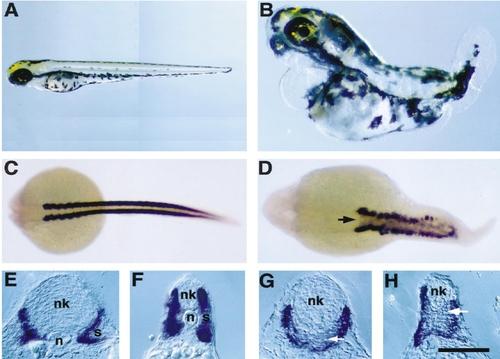
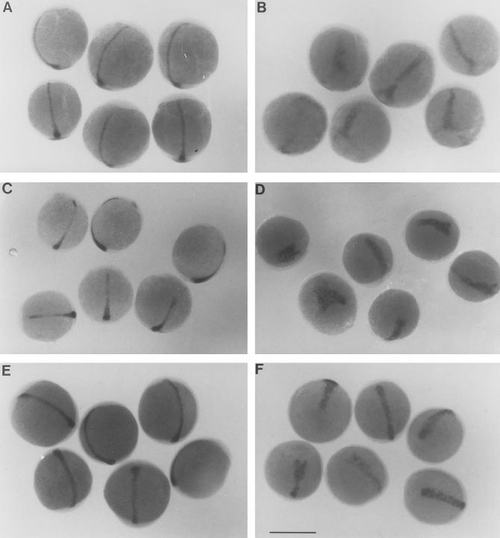
Zebrafish embryos treated with 5-azacytidine lack tails and a differentiated notochord. (A) Wild-type embryos at 48 h of development have an elongated tail and possess a fully differentiated notochord in the trunk and tail. (B) Approximately 30% of embryos treated with 50 or 75 μM 5-azacytidine show reductions in the elongation of the tail, and loss or abnormal development of posterior somites. Structures anterior to the trunk appear to develop normally. (C, D) Transcripts of the muscle-specific α-tropomyosin gene are restricted to lateral bands along the body axis in 24-h wild-type embryos (dorsal view, C) but are also detected in the tissues that underlie the neural tube in 5-azaC-treated embryos (arrow, D). Transverse sections of (E, F) 24-h control and (G, H) 5-azaC-treated embryo hybridized with the α-tropomyosin probe. Control embryos show a large vacuolated notochord (n) directly beneath the neural keel (nk) and well-developed lateral somites (s), while sibling 5-azaC-treated embryos completely lack tissues resembling a notochord (arrow). (E and G, transverse sections posterior to hindbrain; F and H, transverse sections within posterior trunk/tail). Scale bar: A, 300 μm; B, 250 μm; C, 280 μm; D, 150 μm; E–H, 110 μm. |
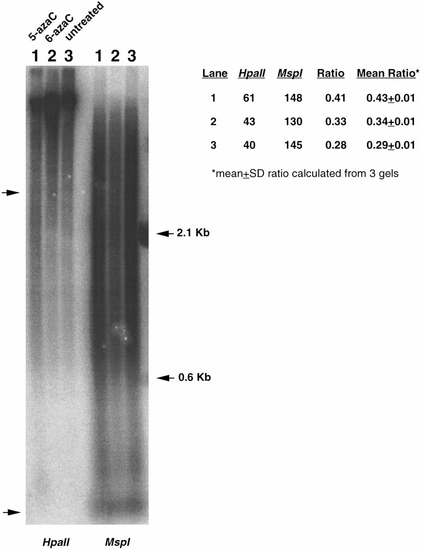
Treatment of zebrafish embryos with 5-azacytidine in vivo results in reduced DNA methylation. DNA collected from 24-h wild-type embryos, and from 5-azaC-treated embryos were digested with HpaII or MspI, Southern transferred and probed with the DANA/mermaid interspersed repetitive DNA sequence as described under Materials and Methods. This revealed an approximately 50% higher relative abundance of low-molecular-weight fragments in HpaII digested DNA from 5-azaC-treated embryos (lane 1) compared to untreated embryos (lane 3), indicating DNA hypomethylation in treated embryos. DNA collected from embryos treated with 6-azaC (lane 2) show a methylation level similar to that observed from untreated embryo DNA. Densitometric analysis was performed as described in the legend for Fig. 4. Ratios are indicated as the average of 3 independent gels ± SD. |
Zebrafish embryos treated with 5-azacytidine have a shortened and thickened axial mesoderm. Expression of the genes no tail (A, B), floating head (C, D), and axial (E, F) occurs in the axial mesoderm of 10-h embryos. (A, C, E) Controls, (B, D ,F) embryos treated with 50 μM 5-azaC from fertilization. Scale bar: A, B, E, and F, 500 μm; C and D, 580 μm. |
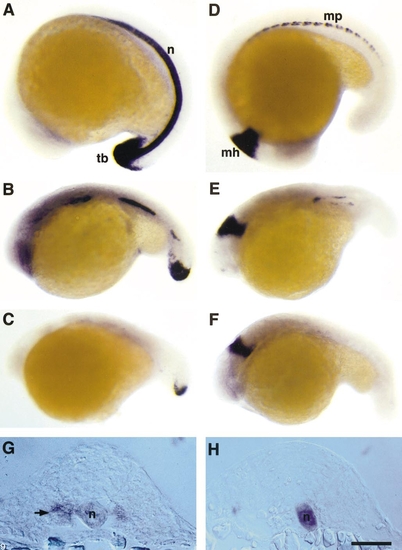
5-Azacytidine treatment of zebrafish embryos causes loss of no tail in the notochord and eng2 expression in muscle pioneer cells. (A) In 19-h wild-type zebrafish embryos, no tail is expressed in continuous pattern in cells of the differentiated notochord (n) and the caudal mesoderm of the tail bud (tb). (B. C) no tail expression in 24-h 5-azaC-treated embryos is discontinuous ranging from (B) short gaps of absent expression along the body axis or (C) nearly complete loss of expressing cells. Expression of no tail in the tailbud mesoderm is normal in 5-azaC-treated embryos. (D) Wild-type embryos express eng2 in the muscle pioneer cells (mp) located at the horizontal septum of developing somites and in cells at the mid/hindbrain boundary (mh). (E, F) 5-AzaC-treated embryos show loss of expression of eng2 in the muscle pioneers cells, but maintains normal eng2 expression in the mid/hindbrain boundary. (G, H), Transverse sections of double-labeled embryos with antisense probes for no tail and eng2. (G) Controls. The muscle pioneer cells are indicated by an arrow. (H) 5-AzaC-treated embryos. No expression of eng2 in the muscle pioneer cells was observed despite the presence of no tail-expressing notochord cells (n). Scale bar: A–F, 220 μm; G and H, 95 μm. |
Reprinted from Developmental Biology, 206, Martin, C.C., Laforest, L., Akimenko, M.-A., and Ekker, M., A role for DNA methylation in gastrulation and somite patterning, 189-205, Copyright (1999) with permission from Elsevier. Full text @ Dev. Biol.