
- Title
-
Zebrafish nodal-related 2 encodes an early mesendodermal inducer signaling from the extraembryonic yolk syncytial layer
- Authors
- Erter, C.E., Solnica-Krezel, L., and Wright, C.V.E.
- Source
- Full text @ Dev. Biol.
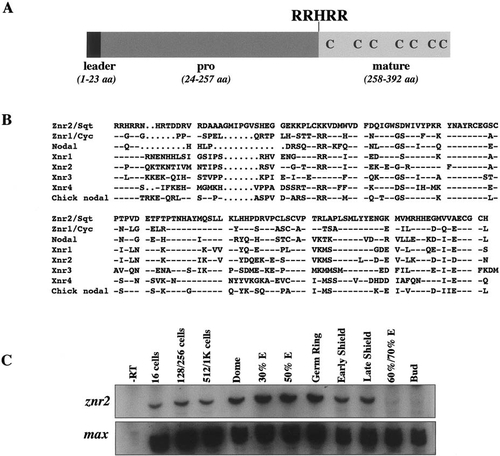
Structure and expression of Znr2. (A) The deduced Znr2 sequence contains a hydrophobic signal sequence (leader), pro and mature ligand domains. Seven conserved cysteine residues in the ligand domain, and the RRHRR proteolytic cleavage site, are indicated. (B) Comparison of mature regions of the known Nodal-related ligands. Znr2/Sqt is 55, 48, 55, 50, 47, 45, and 55% identical to Znr1/Cyc, mouse Nodal, Xenopus Xnr1-4, and chick Nodal, respectively. Dashes represent identical residues, periods represent gaps. (C) RT-PCR analysis during development (stages above lanes) for znr2 expression. max was assayed as a loading control. Abbreviation: E, epiboly. |
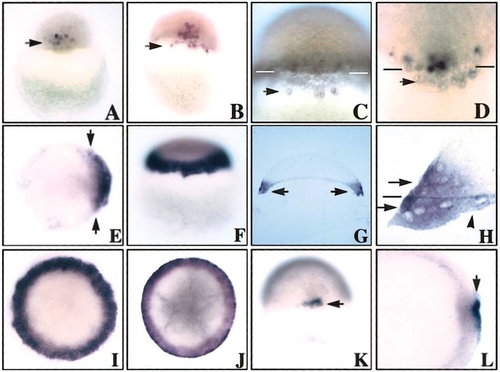
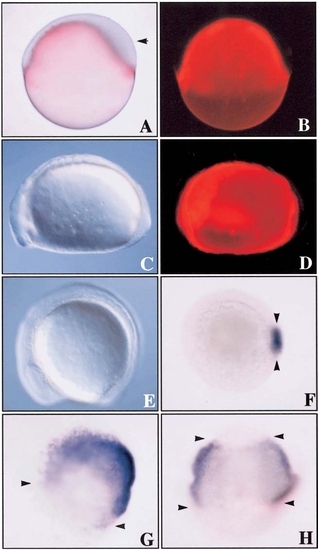
Spatiotemporal expression pattern of znr2 by whole-mount in situ hybridization. (A) 512-cell/high stage. Arrow points to expression in dorsal blastomeres. Dorsal side view. (B–D) Oblong stage. Note localization of transcripts to the dorsal blastoderm and dorsal YSL. Arrows indicate expression around nuclei in YSL. Bars in C and D denote the blastoderm/yolk boundary. (E) Sphere stage. Note expansion, as shown by arrows, of the dorsal expression domain as znr2 transcripts begin to encircle the margin. Animal view. (F) Dome stage. Note expression around entire margin. Side view. (G) Dome stage. Section analysis shows znr2 expression in the margin. (H) Dome stage. Higher magnification of G. Top arrow shows expression in the deep and superficial cells of the blastoderm, the line marks the blastoderm/YSL boundary, the bottom arrow shows expression in the E-YSL, and the arrowhead points to expression in the I-YSL. (I) Fifty percent epiboly. Animal view. (J) Germ ring. Animal view. (K and L) Shield stage. Note expression in superficial dorsal forerunner cells of the dorsal shield. Dorsal and animal view, respectively. |
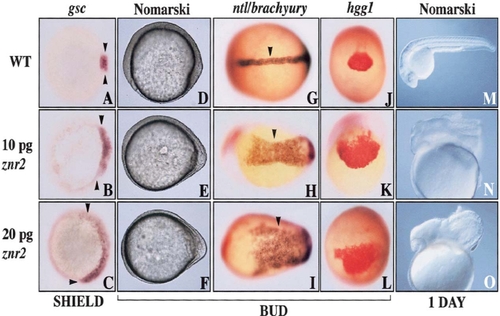
Znr2/Sqt induces dorsoanterior axial fates. The three rows represent embryos that were uninjected (top row) or injected with different doses of znr2 RNA (bottom two rows). (A–C) Animal view shows dorsal expansion of gsc expression by znr2 (early shield stage). (D–F) Nomarski image showing the altered morphology of the embryonic axis in znr2 injected embryos (bud stage). Anterior left. (G–I) Arrowheads indicate broadened ntl expression domains caused by znr2 (bud stage). Dorsal view. (J–L) Broadened hgg1 expression (bud stage). Anterior view. (M–O) Nomarski image showing a hyperdorsalized phenotype (24 hpf). Anterior left. |
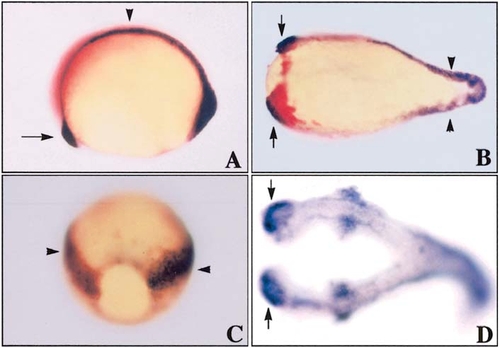
Znr2/Sqt induces secondary axes. (A) Uninjected wild-type sibling (bud stage; lateral view, anterior left) showing hatching gland (arrow) and notochord (arrowhead). (B) znr2 RNA (10 pg) injected into the yolk at the 2- to 4-cell stage. Note duplicated hatching gland (hgg1-positive, red; indicated by arrows) and notochord (ntl-positive, purple, indicated by arrowheads; anterior left). (C) znr2 RNA (2.5 pg) injected into one marginal cell at the 16-cell stage processed for ntl expression; the duplicated notochord is indicated (arrowheads; posterior view). (D) znr2 RNA (5 pg) injected into one marginal cell at the 16-cell stage; both axes contain forebrain (arrows) and neuronal precursors along the length of the body as shown by in situ analysis for zHuC (anterior left). |
Znr2/Sqt can signal to the blastoderm from the YSL. Embryos in A–D, G, and H were coinjected with 100–200 pg znr2 RNA and fluorescent rhodamine dextran (red) in the YSL at the high to oblong stages. (A) Shield stage. Arrowhead indicates enlarged shield. (B) Fluorescence image showing exclusion of injected material from the embryo. (C) Nomarski image of a four-somite-stage embryo that appeared similar to A at shield stage. Note the altered embryonic morphology compared to the uninjected control in E. (D) Fluorescence image showing exclusion of injected material from the embryo. (E) Nomarski image of a six-somite-stage uninjected control embryo. (F–H) gsc expression at shield stage; arrowheads mark expression boundaries. Animal views. (F) Uninjected control. (G) znr2 RNA (100 pg), broadened gsc expression. (H) znr2 RNA (200 pg), gsc is expressed in two very broad domains. Note that examination under fluorescence of embryos in G and H showed no rhodamine dextran-positive cells in the gsc-expressing embryonic blastoderm. |
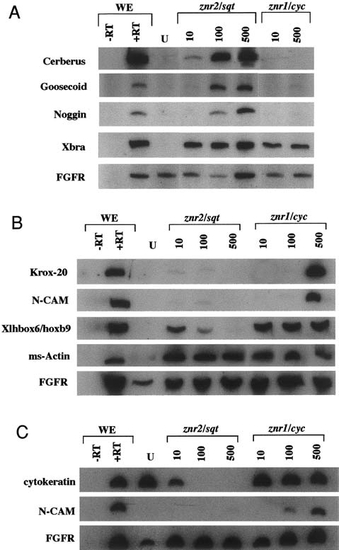
Inductive properties of Znr2/Sqt and Znr1/Cyc. (A) Animal caps from Xenopus embryos injected with znr2/sqt or znr1/cyc RNA were assayed at stage 10.5 (gastrula) for expression of Cerberus, gsc, noggin, and Xbra. Znr2 induced Cer and Xbra at all doses and gsc and noggin at relatively high doses. In contrast, Znr1/Cyc only induced Xbra. (B) Similarly treated animal caps were tested at stage 25 (neurula) for expression of Krox20, N-CAM, XlHbox6/hoxb9, and muscle-specific actin. Znr1/Cyc induced Krox-20 and N-CAM at high doses and XlHbox6/hoxb9 and ms-actin at all doses. In contrast, Znr2 did not induce Krox-20 or N-CAM. XlHbox6/hoxb9 transcript levels decline with increasing znr2 dose. Znr2 induced ms-actin at all doses. (C) Animal caps treated as in B were assayed for expression of cytokeratin, N-CAM, and ms-actin. Cytokeratin levels decline with increasing znr2/sqt dose, but remain constant at all znr1/cyc doses. As in B, N-CAM was induced by high doses of znr1/cyc (the ms-actin expression profile was also reproduced; not shown). The constitutively expressed fibroblast growth factor receptor (FGFR) was used as a loading control. WE, RNA from whole embryos; U, RNA from uninjected animal caps; _RT, no reverse transcriptase control. |
Reprinted from Developmental Biology, 204, Erter, C.E., Solnica-Krezel, L., and Wright, C.V.E., Zebrafish nodal-related 2 encodes an early mesendodermal inducer signaling from the extraembryonic yolk syncytial layer, 361-372, Copyright (1998) with permission from Elsevier. Full text @ Dev. Biol.