- Title
-
Zebrafish vasa homologue RNA is localized to the cleavage planes of 2- and 4-cell-stage embryos and is expressed in the primordial germ cells
- Authors
- Yoon, C., Kawakami, K., and N. Hopkins
- Source
- Full text @ Development
|
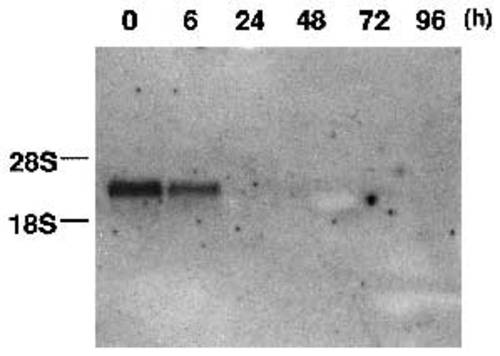
Northern blot analysis shows that vas is maternally supplied. Total RNA from embryos at various developmental stages was blotted and probed with a vas cDNA fragment. Hours after fertilization are shown. Equivalent amounts of total RNA were loaded as judged by the amounts of 28S and 18S rRNA visible (not shown). |
|
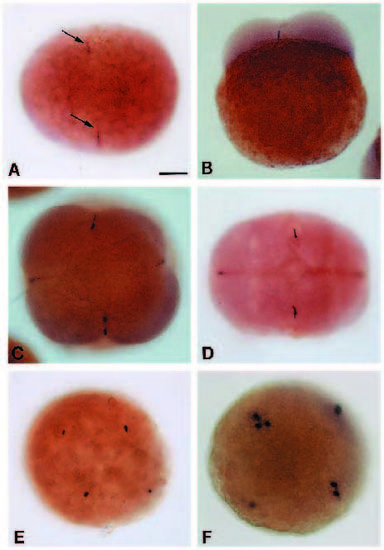
Whole-mount in situ hybridization on early cleavage to domestage embryos. Embryos were hybridized with a vas cDNA fragment riboprobe. (See also Fig. 6 for schematic summary.) All panels show top views of embryos, except in B (side view). vas transcript is detected along the cleavage planes (arrows) of embryos at the 2-cell stage (A,B, same embryo) and 4-cell stage (C). These lines of expression persist through the 8-cell stage (D). vas RNA expression condenses into 4 subcellular clumps by the 32-cell stage (not shown), and remains in this configuration through the 1000-cell stage (E). By the 4000-cell stage (dome stage), vas RNA is no longer subcellularly localized and appears to fill the cytoplasm (F). There are 4-12 vasexpressing cells per embryo at the dome stage. Scale bar, 100 μm. |
|
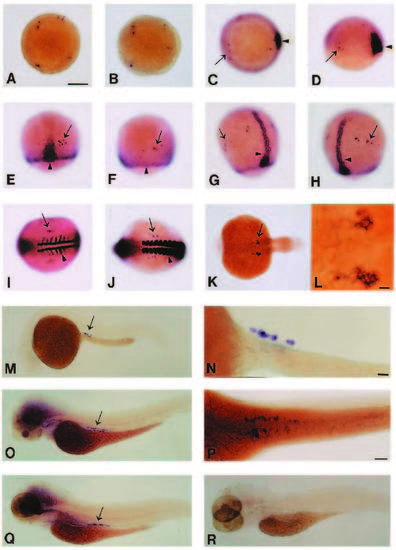
Whole-mount in situ hybridization on older embryos and larvae. Embryos were hybridized with a vas riboprobe. The cells expressing vas are indicated with an arrow. In embryos that were simultaneously hybridized with vas and a second probe to mark the location of particular structures, the cells expressing the second gene are indicated with an arrowhead. In I-R, embryos and larvae are oriented such that anterior is to the left. (See also Fig. 6 for schematic summary.). (A,B) Top views of 2 different 4000-cell-stage (dome) embryos show that the location and numbers of vas-expressing cells are similar but not identical in different embryos. (C,D) Top view (C) and side view (D) of a single embryo double labeled with vas (arrow) and goosecoid (arrowhead). Goosecoid is expressed in the dorsal shield (Statchel et al., 1993). The position of the vas-expressing cells relative to the shield varies. (E-H) Embryos undergoing epiboly double labeled with vas (arrow) and Brachyury (arrowhead). Brachyury is expressed in the developing notochord and the germ ring of the embryo (Schulte-Merker et al., 1992). The dorsal view (E) and ventral view (F) of the same embryo at 70% epiboly show the vas-expressing cells are located around the margin of the embryo. These cells migrate towards the dorsal side of the embryo as seen in the left side view (G) and right side view (H) of one embryo at 90% epiboly. (I-J) Dorsal views of embryos at the 6-somite stage (I) and 10-somite stage (J) are double labeled with vas (arrow) and MyoD (arrowhead). MyoD is expressed in the somites (Weinberg et al., 1996). As seen in I, the vas-expressing cells have clustered on either side of the midline at the level of the third to fifth somite. These cells remain in the same relative position during somitogenesis (J). (K-L) Dorsal view of 20-somite embryo shows that vas-expressing cells remain in 2 clusters (K). Higher magnification view (L) reveals that vas RNA is present in the cytoplasm. (M-Q) vas-expressing cells (arrow) extend posteriorly in 2 bilateral rows during late embryonic and early larval development. (M,N) Side view of 24 hour embryo at low (M) and high (N) magnification. (O,P) Low magnification side view (O) and higher magnification dorsal view (P) of 3 day larva. (Q) Side view of 4 day larva. (R) Side view of a representative sense control (4 days). Scale bars, 200 μm except 20 μm in L, N and 50 μm in P. |
|
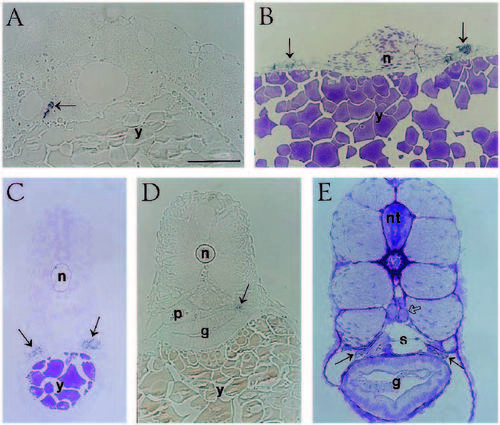
Histological analysis of in situ hybridized embryos and larvae. Transverse sections (2 μm) were prepared following in situ hybridization. vas-expressing cells are indicated with a black arrow. (A) 32- cell, (B) 6-somite, (C) 24 hours, (D) 4 days, (E) 10 days. Note that, in A, at the 32-cell stage, the clump of vas RNA is considerably smaller than the size of a single cell, whereas in the older stages (B-E), the RNA is present throughout the cytoplasm. The position of the vas-expressing cells dorsolateral to the gut (g) and ventral to the pronephric tubules (outlined arrow) in 10 day larvae (E) suggests that these cells are the zebrafish PGCs. Other abbreviations: n, notochord; nt, neural tube; p, pancreas; s, swim bladder; y, yolk. Scale bar, 50 μm. |


