
|
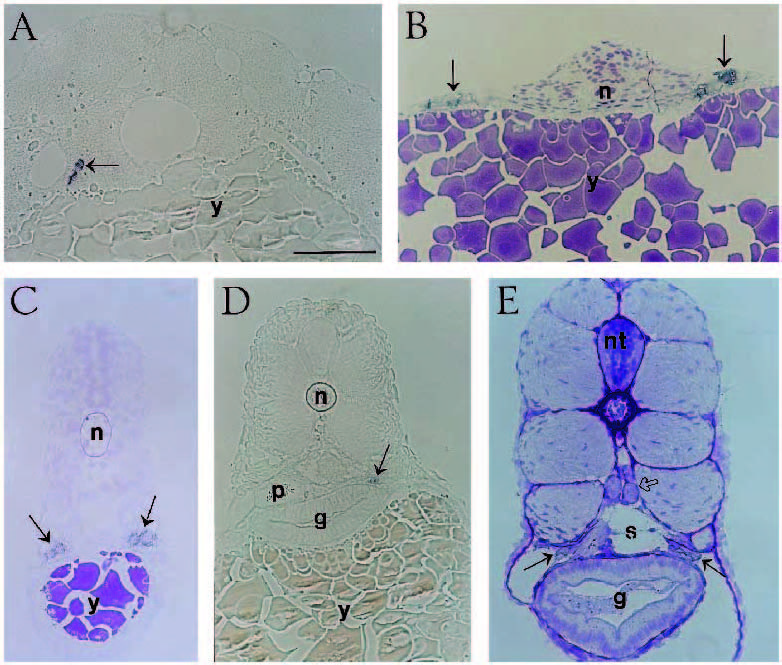
Fig. 5 Histological analysis of in situ hybridized embryos and larvae. Transverse sections (2 μm) were prepared following in situ hybridization. vas-expressing cells are indicated with a black arrow. (A) 32- cell, (B) 6-somite, (C) 24 hours, (D) 4 days, (E) 10 days. Note that, in A, at the 32-cell stage, the clump of vas RNA is considerably smaller than the size of a single cell, whereas in the older stages (B-E), the RNA is present throughout the cytoplasm. The position of the vas-expressing cells dorsolateral to the gut (g) and ventral to the pronephric tubules (outlined arrow) in 10 day larvae (E) suggests that these cells are the zebrafish PGCs. Other abbreviations: n, notochord; nt, neural tube; p, pancreas; s, swim bladder; y, yolk. Scale bar, 50 μm.