- Title
-
Developmental regulation of zebrafish MyoD in wild-type, no-tail and spadetail embryos
- Authors
- Weinberg, E.S., Allende, M.L., Kelly, C.S., Abdelhamid, A., Murakami, T., Andermann, P., Doerre, O.G., Grunwald, D.J., and Riggleman, B.
- Source
- Full text @ Development
|
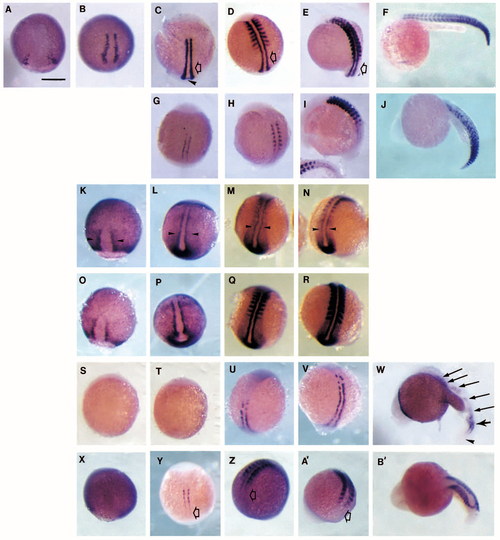
Localization of MyoD, myogenin, and snail1 transcripts in whole embryos. Wild-type embryos were hybridized with MyoD (A-F), myogenin (G-J), snail1 (K-N), or MyoD + snail1 (O-R) probes. spt (S-W) or ntl (X-B′) embryos were hybridized with MyoD probe. Vertical panel rows show embryos at a particular embryonic age: 7-7.5 hours (A), 8-8.5 hours (B,K,O,S,X), 10-10.5 hours (C,G,L,P,T,Y), 12-12.5 hours (D,H,M,Q,U,Z), 14-14.5 hours (E,I,N,R,V,A′), and 24 hours (F,J,W,B′). All embryos are viewed dorsally (either directly or obliquely) with their anterior end to the top except for the 24 hour embryos (F,J,W,B′) which are viewed laterally, anterior to the left. In C-E, open arrows indicate portions of the expression pattern which are absent at the position of corresponding open arrows in Y, Z and A′. In C, the arrowhead indicates cells in the tailbud that express MyoD. In K-N, arrowheads indicate regions of paraxial mesoderm and tailbud that express snail1 but not MyoD. In W, arrows indicate myotome-like bodies expressing MyoD and the arrowhead shows the position of the spade tail in which expression is absent. Scale bar in A indicates 200 µm; all panels at same magnification. |
|
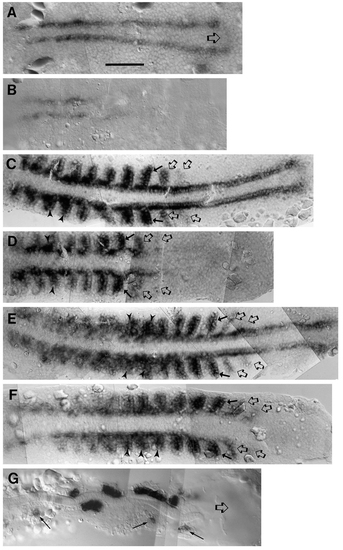
Dorsal views of the trunk regions showing MyoD expression during somite formation and development. 10.5 hour (A,B), 12.5 hour (C.D) and 14.5 hour (E.F,G) wild-type (A,C,E) ntl (B,D,F), or spt (G) embryos were dissected, yolk removed from under the trunk, and the tissue viewed and photographed under DIC optics. All embryos are shown with anterior to the left. An open arrow in A points to the region of expression connecting the two parallel rows of expressing cells. In C-F, open arrows indicate prospective somites either unsegmented or with only partially formed posterior furrows, solid arrows point to the most recently fully formed furrows, and arrowheads indicate older somites with changed shape and MyoD expression pattern. In G, arrows show expressing cells remote from the notochord, open arrow shows thick spade tail area devoid of expression of the gene. All panels are composites of views in which the plane of the notochord is kept in focus. Scale bar in A equals 100 µm, all panels at same magnification. EXPRESSION / LABELING:
|
|
Localization of MyoD transcripts in 40 h embryos. Wild-type embryos, hybridized with MyoD probe as in Fig. 2, are shown in dorsal (A) and lateral (B) views. MyoD-expressing cells in the fin bud and in eye and jaw muscles are indicated respectively by arrows and arrowheads. Scale bar in A indicates 200 µm; both panels at same magnification. |
|
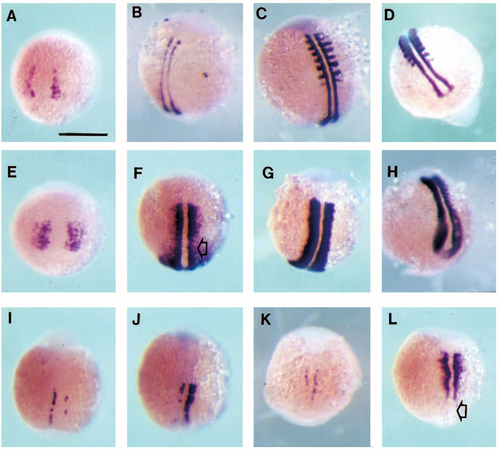
Effect of ectopic Sonic hedgehog expression on MyoD expression in wildtype and mutant embryos. Wild-type control embryos (A-D), wild-type embryos injected with shh RNA at the 1- to 4-cell stage (E-H), spt control embryos (I) and spt embryos injected with shh RNA (J), and ntl control embryos (K) and ntl embryos injected with shh RNA (L) were hybridized with MyoD probe. Embryonic ages of the embryos are 8 hours (A,E), 10 hours (B,F), 11 hours (K,L), 12 hours (C,G,I,J) and 14 hours (D,H). In F,L, open arrows indicate the posterior unsegmented region in which expression differs in injected wild-type and ntl embryos. Scale bar in A indicates 200 µm; all panels at same magnification. |


