
- Title
-
Senescence-Independent Anti-Inflammatory Activity of the Senolytic Drugs Dasatinib, Navitoclax, and Venetoclax in Zebrafish Models of Chronic Inflammation
- Authors
- Hernández-Silva, D., Cantón-Sandoval, J., Martínez-Navarro, F.J., Pérez-Sánchez, H., de Oliveira, S., Mulero, V., Alcaraz-Pérez, F., Cayuela, M.L.
- Source
- Full text @ Int. J. Mol. Sci.
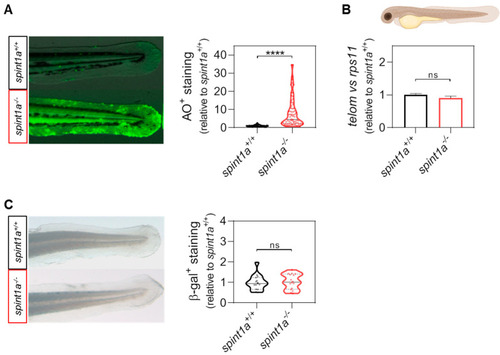
Spint1a-deficient zebrafish larvae do not show premature aging at 3 dpf. (A) Representative images and quantification of the cell death levels by acridine orange (AO) staining assay in the tail of wild type (wt) and Spint1a-deficient larvae. The violin plots with the median shown as a horizontal line show the distribution of AO+ staining and are overlaid with the raw data, where each dot represents an individual. (B) The telomere length was measured in whole zebrafish larvae by qPCR using 40 ng of gDNA and determined as the telomere content relative to the single copy gene rps11. The graph shows the mean ± SEM of 25 pooled larvae (n = 25) and triplicate samples from 2 independent experiments (n = 2). (C) Quantification of the cellular senescence levels by senescence-associated b-galactosidase (SA b-gal) staining assay in the tail of wt and Spint1a-deficient larvae. The violin plots with the median shown as a horizontal line show the distribution of b-gal+ staining and are overlaid with the raw data, where each dot represents an individual. ns, non-significant; **** p < 0.0001, according to unpaired t-test with Welch’s correction (A) and unpaired t-test (B,C). Scale bars, 400 μm. |
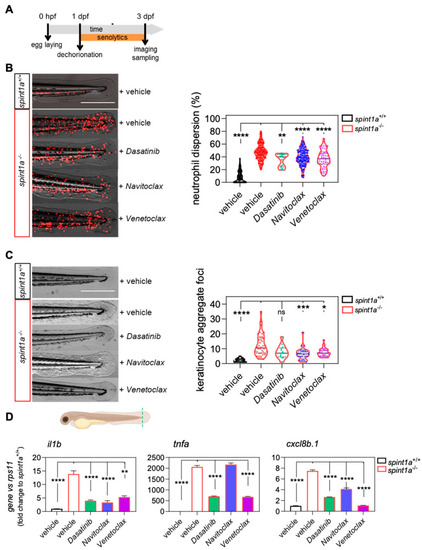
Senolytics ameliorate the skin inflammation phenotype of Spint1a-deficient larvae. (A) General workflow for the treatment with senolytics of the chronic skin inflammation zebrafish model (spint1a−/−). (B) Representative images of neutrophil phenotype and quantification of the number of neutrophils out of the CHT of 3-dpf larvae with neutrophils labeled in red (lyz:DsRED2). (C) Representative images of skin phenotype and quantification of the keratinocyte aggregate foci at the skin. The violin plots with the median shown as a horizontal line show the distribution of DsRED2+ cells and keratinocyte aggregate foci, and are overlaid with the raw data, where each dot represents an individual. (D) The mRNA level of il1b, tnfa, cxcl8b.1 were determined by RT-qPCR and normalized against rps11 in fin folds (indicated at the scheme). The bars show the mean ± SEM of 20 pooled larvae (n = 20) and triplicate samples from 2 independent experiments (n = 2). ns, non-significant; * p < 0.05; ** p < 0.01; *** p < 0.001; **** p < 0.0001 according to Kruskal-Wallis followed by Dunn’s multiple comparison test. CHT: caudal hematopoietic tissue. Scale bars, 400 μm. |
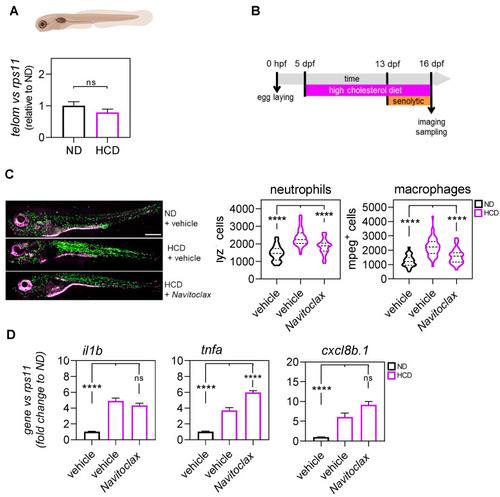
Evaluation of the anti-inflammation effect of navitoclax in the high-cholesterol diet (HCD)-induced metainflammation zebrafish model. (A) The telomere length was measured in 16 dpf zebrafish larvae by qPCR using 40 ng of gDNA and determined as the telomere content relative to the single copy gene rps11. The graph shows the mean ± SEM of 25 pooled larvae (n = 25) and triplicate samples from 3 independent experiments (n = 3). ND (normal diet). HCD (high-cholesterol diet). (B) General workflow for the treatment with navitoclax of the zebrafish model with metainflammation induced by HCD. (C) Representative images and quantification of the total number of neutrophils (purple) and macrophages (green) of 16 dpf (lyz:DsRED2; mpeg1:EGFP) larvae after 3 days of treatment with navitoclax. The violin plots with the median shown as a horizontal line show the distribution of DsRED2+ and EGFP+ cells and are overlaid with the raw data, where each dot represents an individual. (D) The mRNA level of il1b, tnfa, and cxcl8b.1 were determined by RT-qPCR and normalized against rps11 in 16 dpf larvae after treatment. The bars show the mean ± SEM of 20 pooled larvae (n = 20) and triplicate samples from 2 independent experiments (n = 2). ns, non-significant; **** p < 0.0001, according to Kruskal-Wallis followed by Dunn’s multiple comparison test (A), two-way ANOVA followed by Dunnett’s multiple comparison test (C), and Brown-Forsythe ANOVA followed by Dunnett’s T3 multiple comparison test (D). Scale bars, 500 μm. |