FIGURE SUMMARY
Title

A native, highly active Tc1/mariner transposon from zebrafish (ZB) offers an efficient genetic manipulation tool for vertebrates

Authors
Shen, D., Song, C., Miskey, C., Chan, S., Guan, Z., Sang, Y., Wang, Y., Chen, C., Wang, X., Müller, F., Ivics, Z., Gao, B.
Source
Full text @ Nucleic Acids Res.

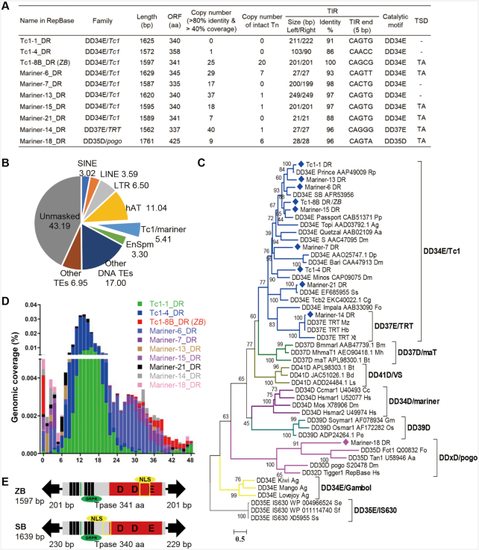
Tc1/mariner transposons in zebrafish. (A) Summary of the 10 autonomous transposons in the zebrafish genome. ORF, open reading frame; Tn, transposon; TIR, terminal inverted repeats; TSD, target site duplication. (B) Genomic coverage (5.41%) of Tc1/mariner transposons in the zebrafish genome. (C) Phylogenetic tree of the 10 transposons identified in this study with reference families of the Tc1/mariner transposons based on their transposases. Bootstrapped (1000 replicates) phylogenetic tree was inferred using the maximum likelihood method in IQ-TREE (37). Each sequence (with the exception of the DD39D subclasses) contained the name of the transposon, the gene sequence number corresponding to the transposon and the Latin abbreviation of the species in which the transposon was located. (D) Age distribution across the 10 Tc1/mariner subfamilies in zebrafish. The x-axis represents the insertion age (Mya, million years ago), and the y-axis represents the percentage of the genome composed of transposon families (%). (E) Transposon structure of ZB and SB transposon.

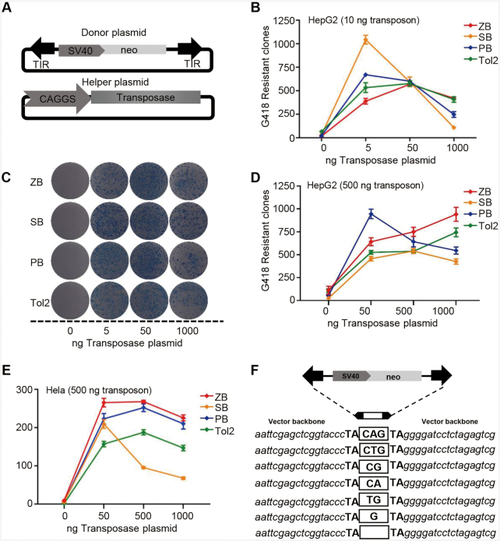
Transposition activities of ZB, SB, PB and Tol2 in human cells. (A) Donor and helper plasmids used in human cells. Donor plasmids: the arrows represent transposon terminal inverted repeats (TIRs); SV40, SV40 promoter; neo, neomycin resistance gene. Helper plasmids: CAGGS, CAGGS promoter; transposase, the transposase (ZB, PB, SB, or Tol2) coding gene. (B) Comparative transposition activities of ZB, SB, PB and Tol2 in HepG2 cells co-transfected with low transposon DNA conditions (10 ng). (C) Stable colonies from HepG2 cells co-transfected with ZB, SB, PB and Tol2 transposons in low transposon DNA conditions (10 ng). (D–E) Comparative transposition activities in HepG2 and HeLa cells co-transfected with the ZB, SB100X, PB and Tol2 transposons in high transposon DNA conditions (500 ng). (F) Excision footprint of ZB. A schematic representation of the donor is shown on top. The pUC19 vector backbone sequences that flank the element in the donor construct are shown in italics. The transposon footprints are depicted in the white box.

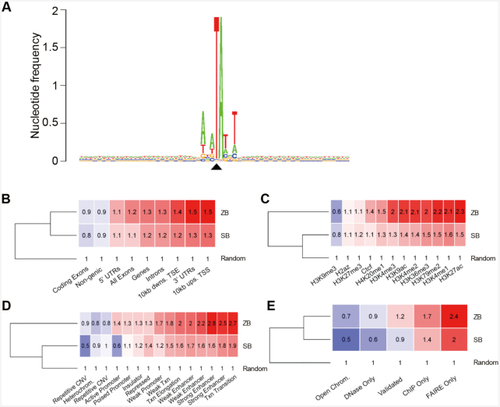
Distribution of ZB integration in the genome of HepG2 cells. (A) The sequence logo shows the consensus sequences at the genomic insertion loci in a 60 bp window around the target TA di-nucleotides. The value 2 (log2 4) on the y axis stands for maximum possible frequency. The black triangle indicates the position of the insertion site. (B) Comparison of ZB and SB insertion frequencies in gene-associated features of the human genome. The numbers indicate fold changes above the random expected frequency, set to 1. Insertion frequencies higher and lower than the random are color-coded in red and blue background, respectively. ‘Ups’: upstream, ‘dwns’: downstream, ‘TSS’: transcriptional start site, ‘TSE’: transcriptional end site. (C) Comparison of ZB and SB insertion frequencies in genomic segments with various histone modifications of the HepG2 genome. (D) Comparison of ZB and SB insertion frequencies in functional genomic segments. (E) Comparison of ZB and SB insertion frequencies in open chromatin measured by one or more of complementary methodologies (DNase-Seq, ChIP-Seq, FAIRE-Seq). The category ‘Open Chrom.’ was established by combining DNaseI-, and FAIRE-Seq results. ‘Validated’ stands for a dataset listing only regions that overlap between any methodologies. The dendrograms are based on the row means.

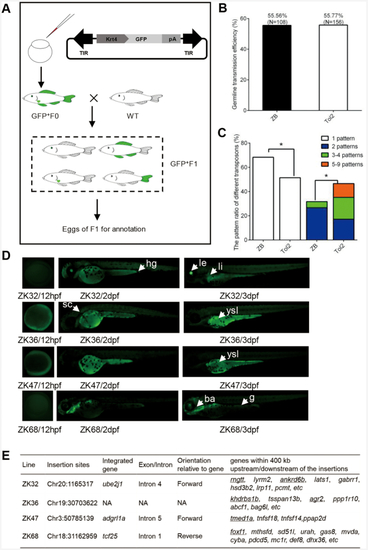
ZB transposon as a transgenic tool in zebrafish. (A) ET constructs used in zebrafish. The arrows represent transposon TIRs; Krt4, Krt4 minimal promoter; GFP, reporter (green fluorescent protein) gene; pA, β-globin polyA. (B) Comparison of germline transmission efficiency mediated by the ZB and Tol2 transposons by screening GFP expression in the F1 generation. (C) Different GFP patterns of F1 offspring generated from ZB- and Tol2-mediated transgenic zebrafish. (D) Fluorescence microscopy images of four ET lines from ZB-mediated transgenic zebrafish at 12 hpf, 2 dpf and 3 dpf. The arrows and arrowheads indicate distinct expression domains with resemblance to the activity of genes in the landing site environment. Abbreviations: ba, branchial arches; sc, spinal cord; g, gut; hg, hindgut; le, lens; li, liver; ysl, yolk syncytial layer. (E) Insertion sites of four ET lines. The predicted target genes that are expressed in similar domains to that shown by the ET lines are underlined.

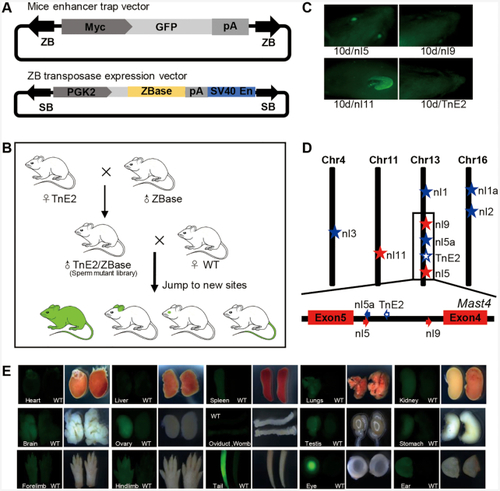
ZB transposon as a transgenic tool in mice. (A) ET constructs used in the mouse. The arrows represent TIRs; Myc, Myc minimal promoter; GFP, reporter (green fluorescent protein) gene; pA, Rabbit globin polyA. ZB transposase expression vector is mediated by SB transposon. SB, SB TIR; PGK2, human phosphoglycerate kinase 2 promoter; SV40En, SV40 enhancer. (B) The procedure used for the generation of a sperm mutant library, which is a double-transgenic mouse containing both a transposon cassette and a transposase expression cassette. Mutant libraries can produce pups with new integration sites after mating with female WT mice. (C) Fluorescence screening in three pups (nl5, nl9 and nl11) revealed the presence of GFP positivity at 10 days of age, while the founder (TnE2) was GFP negative. (D) Diagram of transposon insertions in the mouse genome. The red stars represent GFP-positive insertions, the blue stars represent GFP-negative insertions and the hollow blue star represents the founder (TnE2). (E) GFP expression patterns of nl5 in multiple tissues and organs at 5 days of age.

Acknowledgments
This image is the copyrighted work of the attributed author or publisher, and ZFIN has permission only to display this image to its users. Additional permissions should be obtained from the applicable author or publisher of the image. Full text @ Nucleic Acids Res.