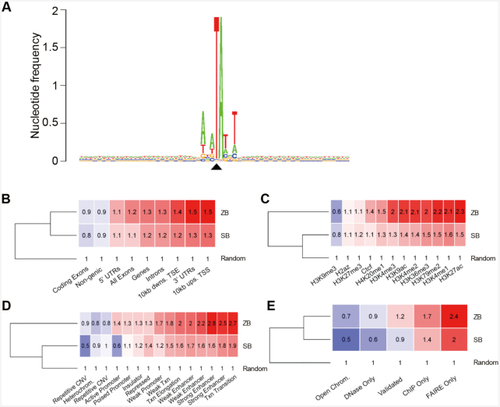
Distribution of ZB integration in the genome of HepG2 cells. (A) The sequence logo shows the consensus sequences at the genomic insertion loci in a 60 bp window around the target TA di-nucleotides. The value 2 (log2 4) on the y axis stands for maximum possible frequency. The black triangle indicates the position of the insertion site. (B) Comparison of ZB and SB insertion frequencies in gene-associated features of the human genome. The numbers indicate fold changes above the random expected frequency, set to 1. Insertion frequencies higher and lower than the random are color-coded in red and blue background, respectively. ‘Ups’: upstream, ‘dwns’: downstream, ‘TSS’: transcriptional start site, ‘TSE’: transcriptional end site. (C) Comparison of ZB and SB insertion frequencies in genomic segments with various histone modifications of the HepG2 genome. (D) Comparison of ZB and SB insertion frequencies in functional genomic segments. (E) Comparison of ZB and SB insertion frequencies in open chromatin measured by one or more of complementary methodologies (DNase-Seq, ChIP-Seq, FAIRE-Seq). The category ‘Open Chrom.’ was established by combining DNaseI-, and FAIRE-Seq results. ‘Validated’ stands for a dataset listing only regions that overlap between any methodologies. The dendrograms are based on the row means.
|
