
- Title
-
Building the vertebrate codex using the gene breaking protein trap library
- Authors
- Ichino, N., Serres, M.R., Urban, R.M., Urban, M.D., Treichel, A.J., Schaefbauer, K.J., Greif, L.E., Varshney, G.K., Skuster, K.J., McNulty, M.S., Daby, C.L., Wang, Y., Liao, H.K., El-Rass, S., Ding, Y., Liu, W., Anderson, J.L., Wishman, M.D., Sabharwal, A., Schimmenti, L.A., Sivasubbu, S., Balciunas, D., Hammerschmidt, M., Farber, S.A., Wen, X.Y., Xu, X., McGrail, M., Essner, J.J., Burgess, S.M., Clark, K.J., Ekker, S.C.
- Source
- Full text @ Elife
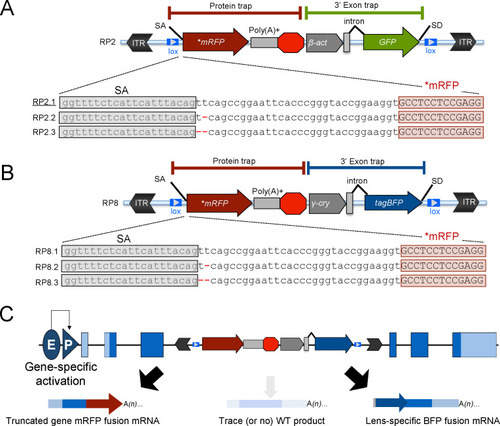
(A–C) Schematic of the GBT system, RP2 and RP8 incorporate a protein-trap cassette fused with three reading frames of AUG-less mRFP reporter and a 3’ exon trap cassette with GFP or tagBFP reporters, respectively. (A) RP2 series (RP2.1, RP2.2 and RP2.3). Underline: Previously published vector construct (B–C) RP8 series (RP8.1, RP8.2 and RP8.3) with a schematic RP8 insertion event showing expected transcription off of a locus below (C). ITR: inverted terminal repeat, SA: splice acceptor, lox: Cre recombinase recognition sequence, *mRFP: AUG-less mRFP sequence, poly (A)+: polyadenylation signal, red octagon: extra transcriptional terminator and putative border element, β-act: carp beta-actin enhancer, γ-cry: gamma crystalline promoter, SD: splice donor, E: enhancer, P: promoter, and WT: wild-type. |
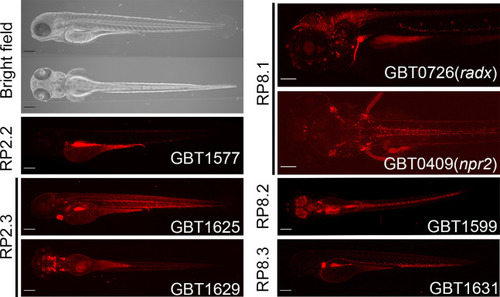
Lateral and dorsal views of representative bright field images at four dpf and lateral or dorsal views of RFP expression patterns at four dpf in GBT1577 integrated RP2.2, GBT1625 and GBT1629 integrated RP2.3, GBT0409 ( |
( |
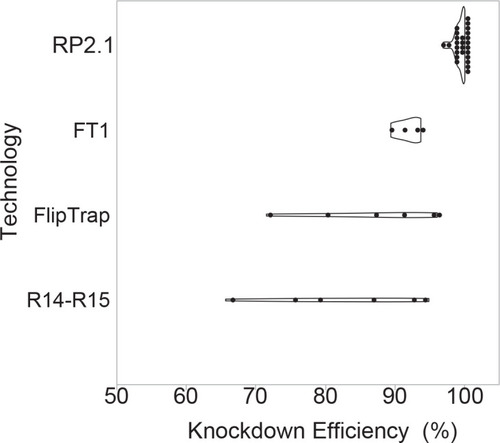
Violin plots comparing percent knockdown efficiency in the analyzed individual lines generated by four protein trap systems. All plots show median. The data of previous protein trap systems were converted from the data in the original articles, R14-R15, our initial R-series protein trap vectors (n = 6), (Clark et al., 2011a; FlipTrap, FlipTrap vectors (n = 6), Trinh et al., 2011; FT1, FT1 vector (n = 4), Ni et al., 2012; RP2.1, RP2.1 vector (n = 26), Clark et al., 2011a; Ding et al., 2013; Ding et al., 2017; El-Rass et al., 2017; Westcot et al., 2015 and unpublished data) (Figure 3—source data 1). The graph was made in JMP14 (SAS, Cary, NC). |
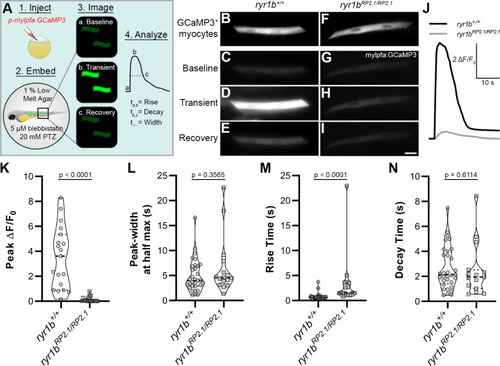
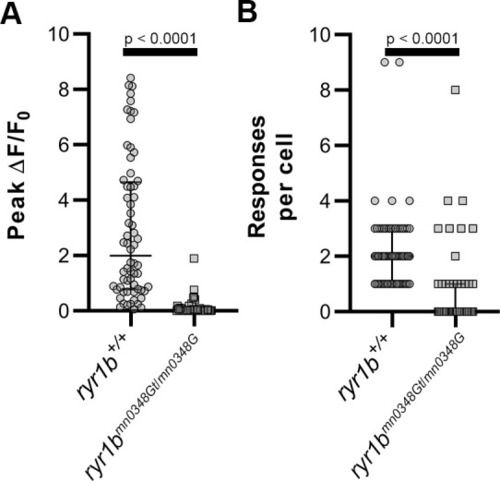
(A) Cartoon showing approach to assay Ca2+ transients in zebrafish myocytes through (1) injection of p-mylpfa:GCaMP3 (Baxendale et al., 2012) at the single cell stage, (2) embedding in 1% low melt agar/20 mM pentylenetetrazole (PTZ)/5 µM (S)-(-)-blebbistatin, (3) imaging for 3 min to record transient-associated changes in myocyte GCaMP3 fluorescence at 2 days post-fertilization, and (4) Ca2+ transient analysis. (B–I) Static images of GCaMP3 expressing myocytes (B, F) and representative GCaMP3 time-series images showing baseline (C, G), transient peak (D, H), and recovery (E, I) in ryr1b+/+ (C–E) and ryr1bmn0348Gt/mn0348Gt (G–I) animals, respectively. Scale bar = 20 µm. (J) Representative ∆F/F0 traces of Ca2+ transients from ryr1b+/+ (black) and ryr1bmn0348Gt/mn0348Gt (gray) myocytes. (K–N) Violin plots comparing transient peak ∆F/F0 (averaged within fish) (K), Ca2+ transient peak-width (L), Ca2+ transient rise (M) and decay (N) time between ryr1b+/+ and ryr1bmn0348Gt/mn0348Gt animals. All plots show median with interquartile range. For (K) nryr1b+/+ = 19 animals, nryr1bmn0348Gt/mn0348Gt = 16 animals. For (L–M) nryr1b+/+ = 32 cells, nryr1bmn0348Gt/mn0348Gt = 16 cells. For (N) nryr1b+/+ = 32 cells, nryr1bmn0348Gt/mn0348Gt = 15 cells. Data are compiled from four independent experiments containing at least two animals in each group. p-values determined using the Mann-Whitney U test. Effect size (Cohen’s d)=1.829 (K) and 0.866 (M). Source data can be found in Figure 4—source data 1 (K, L, M, N) and Figure 4—source data 2 (J). |
( wt = |
( |
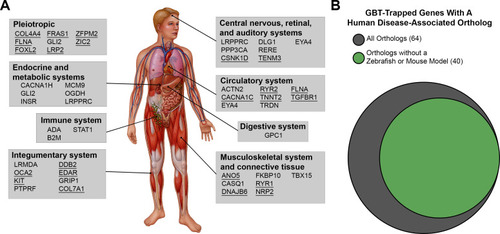
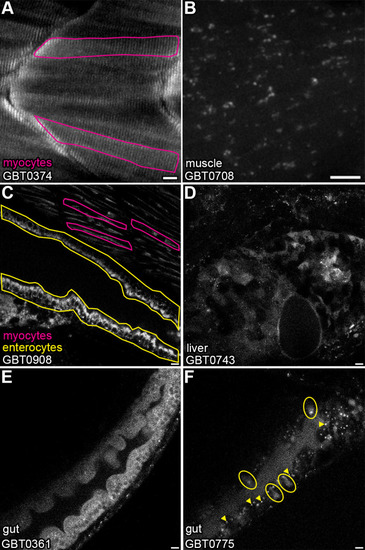
GBT-confirmed lines illuminate and disrupt genes encoding proteins with diverse functions and subcellular localizations. |
( |

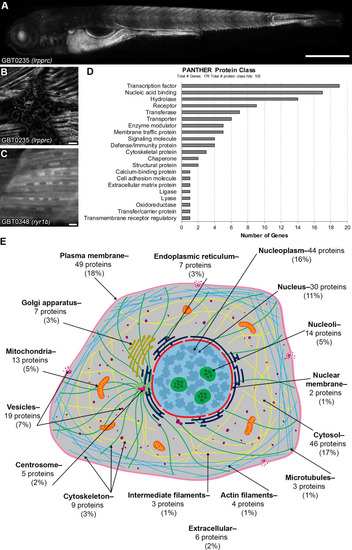
( EXPRESSION / LABELING:
|