
|
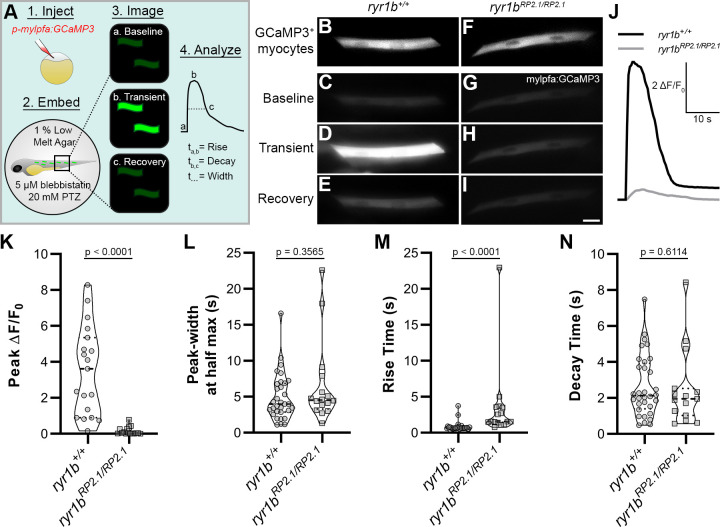
Figure 4 (A) Cartoon showing approach to assay Ca2+ transients in zebrafish myocytes through (1) injection of p-mylpfa:GCaMP3 (Baxendale et al., 2012) at the single cell stage, (2) embedding in 1% low melt agar/20 mM pentylenetetrazole (PTZ)/5 µM (S)-(-)-blebbistatin, (3) imaging for 3 min to record transient-associated changes in myocyte GCaMP3 fluorescence at 2 days post-fertilization, and (4) Ca2+ transient analysis. (B–I) Static images of GCaMP3 expressing myocytes (B, F) and representative GCaMP3 time-series images showing baseline (C, G), transient peak (D, H), and recovery (E, I) in ryr1b+/+ (C–E) and ryr1bmn0348Gt/mn0348Gt (G–I) animals, respectively. Scale bar = 20 µm. (J) Representative ∆F/F0 traces of Ca2+ transients from ryr1b+/+ (black) and ryr1bmn0348Gt/mn0348Gt (gray) myocytes. (K–N) Violin plots comparing transient peak ∆F/F0 (averaged within fish) (K), Ca2+ transient peak-width (L), Ca2+ transient rise (M) and decay (N) time between ryr1b+/+ and ryr1bmn0348Gt/mn0348Gt animals. All plots show median with interquartile range. For (K) nryr1b+/+ = 19 animals, nryr1bmn0348Gt/mn0348Gt = 16 animals. For (L–M) nryr1b+/+ = 32 cells, nryr1bmn0348Gt/mn0348Gt = 16 cells. For (N) nryr1b+/+ = 32 cells, nryr1bmn0348Gt/mn0348Gt = 15 cells. Data are compiled from four independent experiments containing at least two animals in each group. p-values determined using the Mann-Whitney U test. Effect size (Cohen’s d)=1.829 (K) and 0.866 (M). Source data can be found in Figure 4—source data 1 (K, L, M, N) and Figure 4—source data 2 (J).