
|
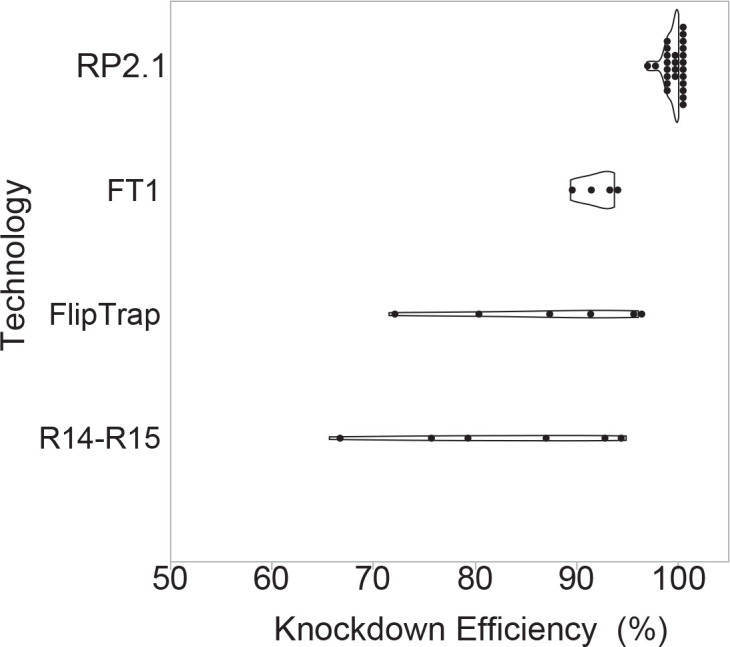
Figure 3 Violin plots comparing percent knockdown efficiency in the analyzed individual lines generated by four protein trap systems. All plots show median. The data of previous protein trap systems were converted from the data in the original articles, R14-R15, our initial R-series protein trap vectors (n = 6), (Clark et al., 2011a; FlipTrap, FlipTrap vectors (n = 6), Trinh et al., 2011; FT1, FT1 vector (n = 4), Ni et al., 2012; RP2.1, RP2.1 vector (n = 26), Clark et al., 2011a; Ding et al., 2013; Ding et al., 2017; El-Rass et al., 2017; Westcot et al., 2015 and unpublished data) (Figure 3—source data 1). The graph was made in JMP14 (SAS, Cary, NC).