
- Title
-
The Reissner Fiber Is Highly Dynamic In Vivo and Controls Morphogenesis of the Spine
- Authors
- Troutwine, B.R., Gontarz, P., Konjikusic, M.J., Minowa, R., Monstad-Rios, A., Sepich, D.S., Kwon, R.Y., Solnica-Krezel, L., Gray, R.S.
- Source
- Full text @ Curr. Biol.
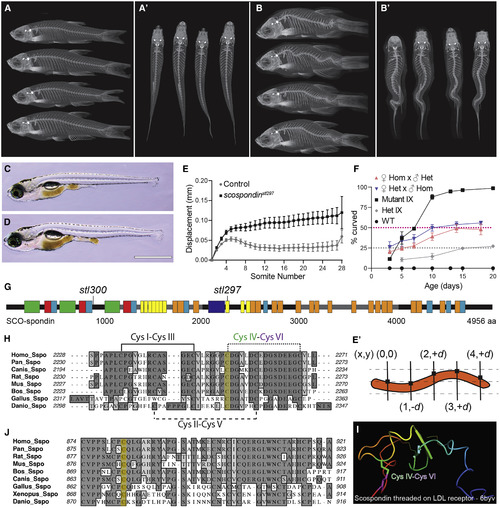
Hypomorphic Mutations of Scospondin Lead to Progressive Scoliosis in Zebrafish (A–B’) MicroCT images of scospondinstl300/+ (A and A’) and scospondinstl300/stl300 mutant zebrafish (B and B’) at 90 dpf, in both lateral (A and B) and dorsal (A’ and B’) views showing adult-viable scoliosis. (C and D) Bright-field image of the typical straight body of a wild type (C) and atypical axial curvatures observed in homozygous scospondinstl297/stl297 mutant (D) larvae at 13 dpf. Scale bar, 1 mm. (E) Dorsal-ventral axis displacement of the notochord in 5-dpf heterozygous scospondinstl297/+ and scospondinstl297/stl297 mutants (mean + SEM, n = 10 and 23, respectively). (E’) Displacement is the absolute value of the dorsal-ventral (y axis) measured against an origin set at the intersection of the first somite boundary and the dorsal edge of the notochord and propagated along the entire axis at each somite boundary for each animal. (F) Incidence of axial curvatures over developmental time for wild type, MZscospondinstl297, and progeny from heterozygous scospondinstl297/+ × scospondinstl297/stl297 mutant crosses from both female and male homozygotes and progeny from heterozygous scospondinstl297/+ incrosses (mean + SEM; n = 112, 105, 116, 138, and 118 embryos, respectively, pooled from three independent clutches). (G) Schematic representation of zebrafish SCO-spondin protein, demarking the location of the scospondin alleles causing scoliosis in zebrafish reported in this study. Boxes represent conserved motifs; legend in Figure S1. (H and J) Protein alignments (Clustal-W) of SCO-spondin protein showing the sequence surrounding the amino acid residues (yellow highlight) affected by the scospondinstl297 (H) and the scospondinstl300 (J) mutations. (I) A homology model of Danio rerio SCO-spondin threaded onto the LDLrA domain derived from an LDL receptor structure (PDB: 6byv). The predicted disulfide bond and labeled cysteine (Cys) residues are highlighted in (H) and (I). See also Figures S1 and S2. PHENOTYPE:
|
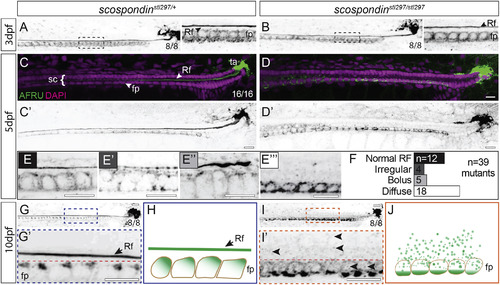
Disassembly of the Reissner Fiber due to Defects in Secretion from the Floor Plate Is Correlated with the Onset of Axial Curvatures in Zebrafish Maximal Z projections of confocal stacks of the caudal region of the tail and spinal cord immunostained against the Reissner fiber in scospondinstl297/+ and scospondinstl297/stl297 mutants at 3 dpf (A and B), 5 dpf (C–F), and 10 dpf (G, G’, I, and I’). Rf, Reissner fiber; fp, floor plate; sc, spinal cord; ta, terminal ampulla. (A and B) At 3 dpf, both heterozygotes (A) and mutants (B) have an assembled Reissner fiber (8/8 each genotype). Insets to the right of (A) and (B) highlight a magnified region (dashed box). (C–E''') Pseudocolored merge from maximal Z projections of confocal stacks showing Reissner fiber (green) and DAPI (magenta) marking nuclei (C and D) and inverted grayscale image of Reissner fiber at 5 dpf (C’ and D’). We observed the Reissner fiber in all heterozygous mutants (100%; n = 16; C), but the scospondinstl297/stl297 showed some with the fiber (31%; n = 39) and some with a fiber in various stages of disassembly (69%; n = 39; D). We classified Reissner fiber staining as normal (E), irregular (E’), bolus (E’’), or diffuse (E’’’) and counted the number of mutants in each class (F). Scale bars, 10 μm. (G and I) At 10 dpf, we observed the Reissner fiber in all heterozygous controls (G), which was completely lost in the mutants (I; 100%; n = 7 and 8, respectively). Scale bars, 10 μm. (H and J) Schematic representation of Reissner material localization at 10 dpf. In wild-type or heterozygous animals, Reissner material localizes to the apical surface of floor plate cells and is assembled into a Reissner fiber (H). In scospondinstl297/stl297 mutants, the Reissner fiber is missing and Reissner material localizes at the basal portion of the floor plate (J). See also Figures S1 and S2. PHENOTYPE:
|
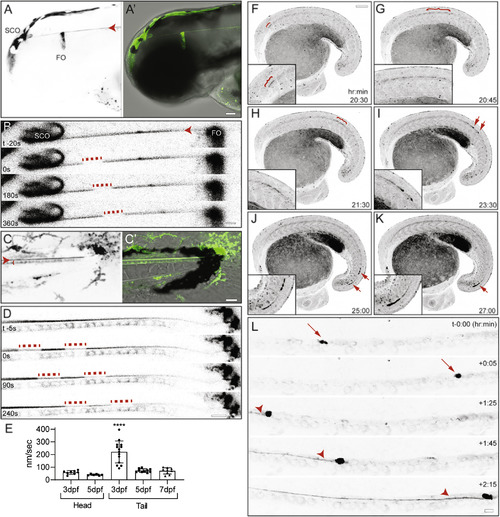
Dynamic Properties of the Reissner Fiber Revealed in Scospondin-GFPut24 Knockin Zebrafish (A) Inverted grayscale maximal Z projection of confocal stack of scospondin-GFPut24/+ embryo at 3 dpf. Expression in the subcommissural organ (SCO) and flexural organ (FO) in the head with Reissner fiber (red arrowhead; A). Merge of differential interference contrast (DIC) image and pseudocolored SCO-spondin-GFP expression (green; A’) is shown. Scale bar, 50 μm. (B) Inverted grayscale frames from a time-lapse confocal dataset from a scospondin-GFPut24/+ embryo head at 3 dpf. At time (t) = 0, a region was photobleached using a short, high-energy pulse from a 488-nm solid state laser, which allowed for manual tracking of the movement of the bleached region from rostral to caudal. Scale bar, 10 μm. (C) Inverted grayscale maximal Z projection of confocal stack of scospondin-GFPut24/+ embryo tail at 3 dpf. The Reissner fiber (red arrowhead) and floor plate (red bracket) are labeled with GFP (C). Merge of DIC image and pseudocolored SCO-spondin-GFP expression (green; C’) is shown. Scale bar, 20 μm. (D) Inverted grayscale frames from a time-lapse confocal dataset from a scospondin-GFPut24/+ embryo head at 3 dpf. At time (t) = 0, two regions were photobleached as in (B), which allowed for manual tracking of the movement of the bleached region from rostral to caudal. Scale bar, 10 μm. (E) Average velocity as nanometers (nm) per second (s) were calculated manually for multiple embryos at 3, 5, and 7 dpf in experiments depicted in (B) and (D) (n = 13, 9, and 8, respectively). The average velocity for each individual embryo was plotted as boxplots (mean ± SD; ∗∗∗∗p < 10−4). (F–K) Single frames from a time-lapse confocal dataset taken during tail bud development (20–30 h post-fertilization; see Video S2) presented as inverted grayscale maximal Z projections. At the first indication of Reissner fiber formation (F–H), red brackets highlight fibers of SCO-spondin-GFP, which travel in a caudal direction. As development of the Reissner fiber roceeds (I–K) we observed the fiber could also accumulate as a bolus SCO-spondin-GFP material (red arrows), which could then travel rapidly in a rostral to caudal direction. Insets in the lower left-hand side of each panel are digitally enlarged portions of the region containing SCO-spondin-GFP-labeled material. Scale bars, 100 μm in main and 50 μm in inset. Time stamp is h:min post-fertilization. (L) Frames from a time-lapse confocal dataset taken during tail bud development (20–22 h post-fertilization; see Video S2) presented as inverted grayscale maximal Z projections. Red arrows highlight SCO-spondin-GFP-labeled bolus material, although red arrowheads indicate bolus material leading the Reissner fiber. Scale bar: 10 μm. See also Figure S3 and Video S1, S2, S3, S4, and S5. EXPRESSION / LABELING:
|
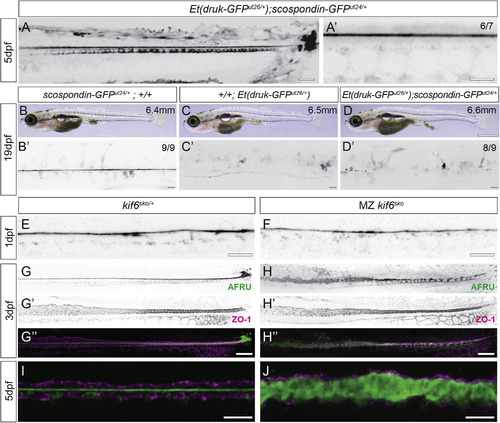
Loss of the Reissner Fiber Is Associated with Scoliosis in Additional Independent Scoliosis Mutant Zebrafish Strains (A and A’) Inverted grayscale maximal Z projections of confocal images of Et(druk-GFPdut26/+); scospondin-GFPut24/+ demonstrating typical assembly of the Reissner fiber, floor plate, and terminal ampulla expression in these mutant knockin embryos at 5 dpf. Note that GFP expression is contributed both by the Et(druk-GFPdut26/+) transgene insertion and from the scospondin-GFPut24/+ allele. Scale bars, 25 μm in (A) and 5 μm in (A’). (B–D) Bright-field images of a wild-type juvenile scospondin-GFPut24/+ (B), Et(druk-GFPdut26/+) (C), and Et(druk-GFPdut26/+); scospondin-GFPut24/+ (D) displaying the onset of mild scoliosis. Scale bar, 1 mm; standard length in upper right corner. (B’–D’) Inverted grayscale maximal Z projections of confocal images of the same fish in (B), (C), and (D) to highlight the spinal cord are shown. At 19 dpf, in wild-type scospondin-GFPut24/+, we observe high expression of the Reissner fiber (100%; n = 14 size range 6.3–6.8 mm; B’); in scoliosis mutant Et(druk-GFPdut26/+); +/+, the Reissner fiber is not labeled but some spinal cord cells express GFP (n = 6 size range 6.0–6.5 mm); and in double mutant Et(druk-GFPdut26/+); scospondin-GFPut24/+, we observed curvature of the spinal canal and a complete loss of a Reissner fiber (94%; n = 16 size range 6.1–7.0 mm). Scale bars, 25 μm. (E and F) Inverted grayscale maximal Z projections from confocal imaging of AFRU-stained zebrafish embryos at 1 dpf (30 hpf). The Reissner fiber is observed in heterozygous kinesin family member 6 (kif6sko/+) (E) and homozygous kif6sko mutants (F) (8/8; for each genotype). Scale bars, 10 μm. (G–H”) Inverted grayscale maximal Z projections of confocal imaging of AFRU- and ZO-1-stained zebrafish at 3 dpf. ZO-1 localizes to tight junctions and shows the location of the central canal epithelium. Heterozygous kif6sko/+ animals have an intact Reissner fiber in the central canal (13/13; G–G”), whereas in homozygous kif6sko, the Reissner fiber is disassembled and Reissner material fills the space of the central canal (12/13; H–H”). Scale bars, 25 μm. (I and J) Merge of maximal Z projections of confocal imaging of AFRU- and ZO-1-stained zebrafish at 5 dpf. Heterozygous kif6sko/+ animals have an intact Reissner fiber in the central canal (I), but in homozygous kif6sko animals, diffuse Reissner material fills the central canal lumen (J). Scale bars, 10 μm. EXPRESSION / LABELING:
PHENOTYPE:
|