FIGURE SUMMARY
Title

Deletion of a conserved Gata2 enhancer impairs haemogenic endothelium programming and adult Zebrafish haematopoiesis

Authors
Dobrzycki, T., Mahony, C.B., Krecsmarik, M., Koyunlar, C., Rispoli, R., Peulen-Zink, J., Gussinklo, K., Fedlaoui, B., de Pater, E., Patient, R., Monteiro, R.
Source
Full text @ Commun Biol

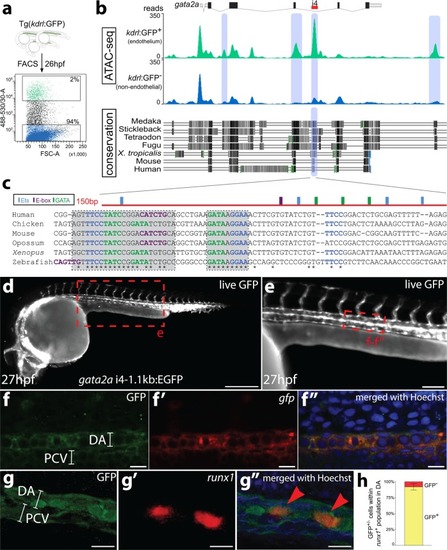
The i4 enhancer in the <italic>gata2a</italic> locus is conserved and drives pan-endothelial expression of a GFP reporter in zebrafish.

aKdrl:GFP+ (green) and kdrl:GFP (blue) cells were FACS-sorted from 26hpf embryos and used for preparation of ATAC-seq libraries. b The image of the mapped reads represents stacked means of two biological ATAC-seq replicates. Differential peak analysis identified four chromatin regions (blue shading) in the locus of gata2a that are significantly more open in the kdrl:GFP+ population (p < 0.0001). A region in the fourth intron (termed i4 enhancer) is conserved throughout vertebrates. Black and grey shading denotes regions of high conservation between the species analysed. c The highly conserved 150 bp region (red) contains putative transcription factor binding sites, mapped computationally. Light blue: Ets binding sites; purple: E-box binding sites; green: GATA binding sites; asterisks: conserved residues. d Widefield fluorescent image of a live Tg(gata2a-i4-1.1 kb:GFP) zebrafish embryo at 27hpf showing GFP fluorescence in the endothelial cells and in the heart (endocardium). e Higher magnification image of the trunk of the embryo from panel d. ff″ Confocal images of a trunk fragment of a Tg(gata2a-i4-1.1 kb:GFP) embryo immunostained with anti-GFP antibody (f) and probed for gfp mRNA (f′) at 25hpf. f″ Merged images from panels ff′ with Hoechst nuclear staining in blue, showing complete overlap of GFP protein and mRNA. gg″ Confocal images of the dorsal aorta (DA) and posterior cardinal vein (PCV) of a Tg(gata2a-i4-1.1 kb:GFP) embryo immunostained with anti-GFP antibody (g) and probed for runx1 mRNA (g′) at 25hpf. See panel e for approximate position within the embryo. g″ Merged images from panels gg’, also showing Hoechst nuclear staining in blue. h Counting of the runx1+ cells represented in panels g′–g″ in 25 embryos shows that >90% of runx1+ cells are also GFP+. N = 3. Error bars: ± SD. See also Supplementary Fig. 1.

EXPRESSION / LABELING:
Gene:
Fish:
Anatomical Terms:
Stage: Prim-5

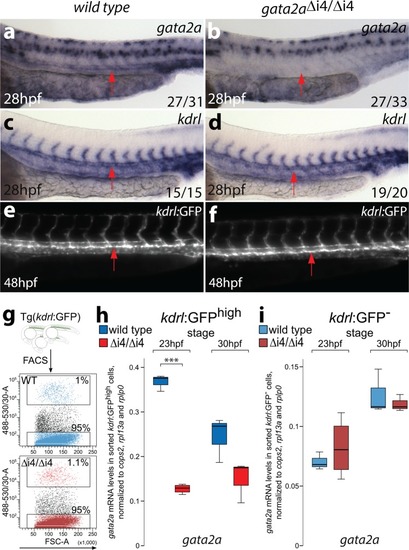
Deletion of the i4 enhancer in <italic>gata2a</italic><sup>Δi4/Δi4</sup> mutants leads to reduced levels of <italic>gata2a</italic> mRNA in the endothelium.

a, b A significant majority of gata2aΔi4/Δi4 mutants have reduced levels of gata2a mRNA in the dorsal aorta (arrows) at 28hpf, compared to wild-type siblings, as detected with in situ hybridization. (Χ2 = 10.720, d.f. = 1, p < 0.01). The expression in the neural tube appears unaffected. c, d In situ hybridization for the endothelial marker kdrl at 28hpf reveals no difference between gata2aΔi4/Δi4 mutants and wild-type siblings. The dorsal aorta (arrows) appears unaffected. e, f Live images of the trunks of 48hpf Tg(kdrl:GFP) and Tg(kdrl:GFP); gata2aΔi4/Δi4 embryos show normal vascular morphology in the mutants. The endothelium of the dorsal aorta (arrows) appears normal in the gata2aΔi4/Δi4 embryos. gKdrl:GFPhigh and kdrl:GFP cells were sorted from non-mutant (WT, blue) and gata2aΔi4/Δi4 (red) embryos carrying the Tg(kdrl:GFP) transgene. h, i qRT-PCR on RNA isolated from the sorted kdrl:GFPhigh or kdrl:GFP- cells (panel g) shows decreased levels of gata2a mRNA in the endothelium of gata2aΔi4/Δi4 mutants at 23hpf (t = 20.026,d.f. = 5, p < 0.001) compared to wild-type. At 30hpf this difference is not statistically significant (t = 2.146, d.f. = 4, p = 0.098). There is no difference in gata2a mRNA levels in non-endothelial cells between wild-type and gata2aΔi4/Δi4 mutants (23hpf: t = 0.69, d.f. = 5, p > 0.5; 30hpf: t = 0.618, d.f. = 4, p > 0.5). N = 4 for gata2aΔi4/Δi4 at 23hpf, N = 3 for other samples. Note different scales of expression levels. ***p < 0.001. See also Supplementary Fig. 2.

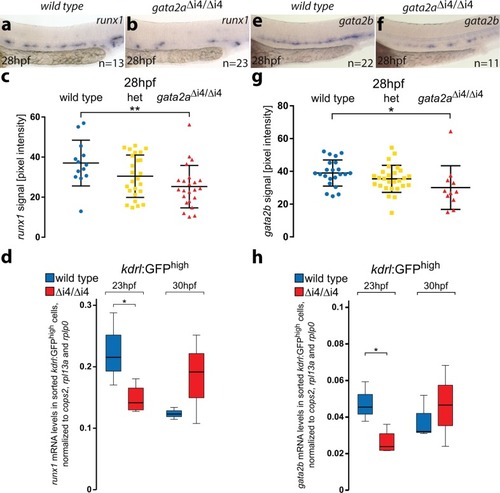
Loss of <italic>gata2a</italic> expression in the endothelium of <italic>gata2a</italic><sup>Δi4/Δi4</sup> mutants leads to decreased levels of <italic>runx1</italic> and <italic>gata2b</italic> in the HE.

a, b In situ hybridization for runx1 expression in the HE of wild-type and gata2aΔi4/Δi4 embryos at 28hpf. c Quantification of the runx1 in situ hybridization signal from wild-type (blue), heterozygous gata2a+/Δi4 (het, yellow) and gata2aΔi4/Δi4 (red) siblings at 28hpf shows significant decrease in runx1 pixel intensity in the DA in the homozygous mutants compared to wild-type (µwt = 34.8, µmut = 25.3; F = 4.956, d.f. = 2, 58; ANOVA),**p < 0.01. n = 14, wild-type; n = 25, het; n = 23, gata2aΔi4/Δi4. Error bars: mean ± SD. d qRT-PCR on RNA isolated from the sorted kdrl:GFP+ cells shows decreased levels of runx1 mRNA in the endothelium of gata2aΔi4/Δi4 mutants at 23hpf (t = 2.585, d.f. = 5, p < 0.05) but not at 30hpf (t = 1.326, d.f. = 4, p > 0.2), compared to wild-type. N = 4 for gata2aΔi4/Δi4 at 23hpf, N = 3 for other samples. Note different scales of expression levels. *p < 0.05. e, fGata2b expression in the HE of wild-type and gata2aΔi4/Δi4 embryos at 28hpf. g Quantification of the gata2b mRNA signal, detected by in situ hybridization, from wild-type (blue), heterozygous gata2a+/Δi4 (het; yellow) and gata2aΔi4/Δi4 (red) siblings at 28hpf shows significant decrease in gata2b pixel intensity in the DA in the homozygous mutants compared to wild-type (µwt = 39, µmut = 30.1; F = 5.05, d.f. = 2, 54; ANOVA), *p < 0.05. n = 22, wild-type; n = 24, het; n = 11, gata2aΔi4/Δi4. Error bars: mean ± SD. h qRT-PCR in sorted kdrl:GFP+ cells showed decreased levels of gata2b mRNA in the endothelium of gata2aΔi4/Δi4 mutants at 23hpf (t = 3.334, d.f. = 5, p < 0.05) but not at 30hpf (t = 0.373, d.f. = 4, p > 0.7), compared to wild-type. N = 4 for gata2aΔi4/Δi4 at 23hpf, N = 3 for other samples. *p < 0.05. See also Supplementary Figs. 3 and 4.

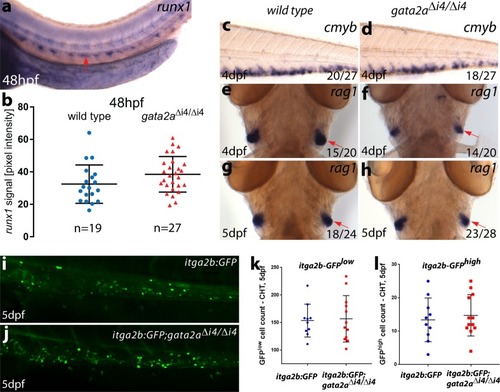
<italic>Gata2a</italic><sup>Δi4/Δi4</sup> mutants display a recovery of the initial haematopoietic defects from 48hpf.

a Representative image of runx1 expression in the trunk of a wild-type embryo at 48hpf showing runx1 mRNA in the dorsal aorta (arrow). b Quantification of the runx1 in situ hybridization signal in wild-type (blue) and gata2aΔi4/Δi4 mutants (red) siblings at 48hpf. There is no significant difference in runx1 pixel intensity in the DA between the homozygous mutants and wild-type (µwt = 33.1, µmut = 37.5, t = 1.410, d.f. = 44, p = 0.17. n = 19, wild-type; n = 27, gata2aΔi4/Δi4). Error bars: mean ± SD. c, d In situ hybridization for cmyb in the CHT. We detected no difference in expression between wild-type and gata2aΔi4/Δi4 siblings at 4dpf. (eh) In situ hybridization (ventral view) for rag1 in the thymii, showing a slight decrease (relative to wild-type) in rag1 (red arrows) in approximately half of the homozygous mutant embryos at 4dpf. This effect is absent at 5dpf. (i, j) Maximum projections of itga2b:GFP transgenic embryos in the CHT at 5dpf in i wild-type and jgata2aΔi4/Δi4 siblings. k HSPC (itga2b:GFPlow) counts in the CHT of wild-type (n = 10) and gata2aΔi4/Δi4 mutants (n = 12) at 5dpf. No difference was detected between genotypes (μwt = 153.5; μmut = 145.5; p = 0.98, Mann-Whitney test). l Thrombocyte (itga2b:GFPhigh) counts in the CHT of wild-type (n = 10) and gata2aΔi4/Δi4 mutants (n = 12) at 5dpf. No difference was detected between genotypes (μwt = 13; μmut = 13; p = 0.71, Mann-Whitney test). Error bars: median ± SD.

EXPRESSION / LABELING:
Genes:
Fish:
Anatomical Terms:
Stage Range: Long-pec to Day 5
PHENOTYPE:
Fish:
Observed In:
Stage: Day 4

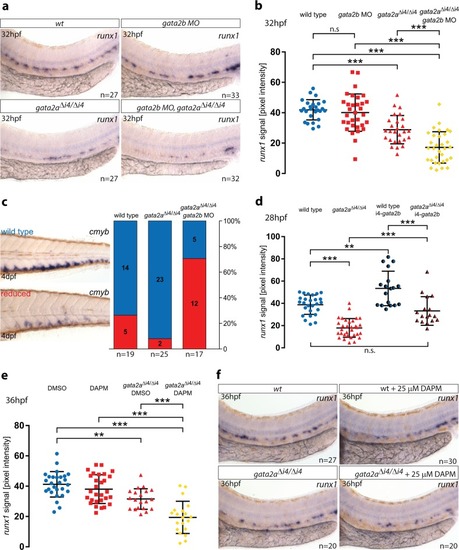
<italic>Gata2b</italic> and Notch signalling are sufficient to recover haematopoietic markers in <italic>gata2a</italic><sup>Δi4/Δi4</sup> mutants.

a Expression of runx1 in HE at 32hpf in wild-type (wt), gata2b MO-injected (7.5 ng) wt embryos, gata2aΔi4/Δi4 mutants and gata2b MO-injected (7.5 ng) gata2aΔi4/Δi4 mutants. b Quantification of the runx1 in situ hybridization (ISH) signal in wt, gata2b morphants, gata2aΔi4/Δi4 mutants and gata2aΔi4/Δi4 mutants injected with gata2b MO. runx1 expression is decreased in gata2aΔi4/Δi4 mutants (µwt = 41.9, µmut = 28.9; F = 44.641, d.f. = 3, 62.3; p < 0.001). Gata2b MO knockdown significantly decreases runx1 in the DA of gata2aΔi4/Δi4mutants (µmut = 28.9, µmut+MO = 17.2), but not wt embryos at 32hpf (µwt = 41.9, µMO = 40.1; p = 0.89, p = 0.89, Games-Howell post-hoc test, Welch’s ANOVA). n = 27, wt; n = 27, gata2aΔi4/Δi4; n = 33, wt + gata2b MO; n = 32, gata2aΔi4/Δi4 + gata2b MO. c Scoring cmyb expression at 4dpf in wt, gata2aΔi4/Δi4 mutants and gata2aΔi4/Δi4 mutant embryos injected with gata2b MO as wt (blue) or reduced (red). Gata2b MO knockdown (7.5 ng) inhibits the haematopoietic recovery of gata2aΔi4/Δi4 mutants. (Χ2 = 18.784, d.f. = 2, p < 0.001). d Quantification of the runx1 ISH signal, from 28hpf wt embryos (blue), gata2aΔi4/Δi4 mutants (red) and their siblings injected with a gata2a-i4-450bp:gata2b construct (shaded blue and red). Ectopic expression of gata2b increases runx1 expression in the HE of wt embryos (µwt = 38.8, µwt+gata2b = 53.4; p < 0.01) and rescues runx1 expression in the DA of gata2aΔi4/Δi4 mutants to wt levels (µmut = 17.9, µmut+gata2b = 33.2; p < 0.001; µwt = 38.8, µmut+gata2b = 33.2; p = 0.31, Tukey HSD post-hoc test). n = 25, wt; n = 33, gata2aΔi4/Δi4;n = 18, wt + gata2a-i4-450bp:gata2b construct; n = 17, gata2aΔi4/Δi4 + gata2a-i4-450bp:gata2b construct. e Quantification of the runx1 ISH signal at 36hpf in embryos treated with a suboptimal dose (25 μM) of the Notch inhibitor DAPM. 25 μM DAPM showed no effect on runx1 expression in wt compared to DMSO-treated embryos (µDMSO = 40.5, µDAPM = 38; p = 0.735, Tukey HSD post-hoc test). DMSO-treated gata2aΔi4/Δi4 mutants show a decrease in runx1 expression (µDMSO = 40.5, µmut+DMSO = 31.5; F = 25.774, d.f. = 3, 91; ANOVA). DAPM treatment significantly reduced runx1 expression in the DA gata2aΔi4/Δi4 mutants (µmut+DMSO = 31.5, µmut+DAPM = 19.4). n = 27, wt +DMSO; n = 20, gata2aΔi4/Δi4 + DMSO; n = 30, wt + DAPM; n = 20, gata2aΔi4/Δi4 + DAPM. f Representative images of the average runx1 expression at 36hpf in wt and gata2aΔi4/Δi4 mutants treated with 25 μM DAPM. Error bars: mean ± SD. **p < 0.01; ***p < 0.001. See also Supplementary Fig. 5.

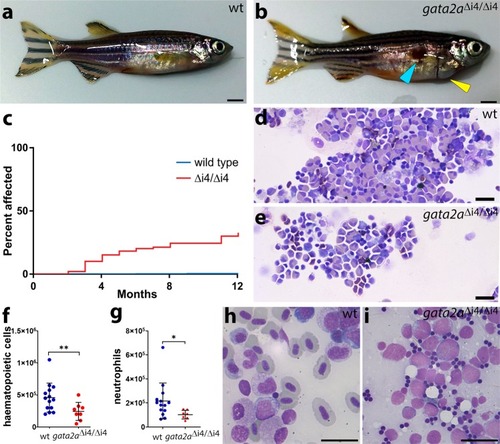
<italic>Gata2a</italic><sup>Δi4/Δi4</sup> mutants show cardiac oedema, hypocellularity and marrow failure.

a, b General morphology of zebrafish adults: a wild-type; bgata2aΔi4/Δi4 mutant showing skin infection (blue arrowhead) and pericardial oedema (yellow arrowhead). c Over 25% (n = 29/108) of gata2aΔi4/Δi4 mutants (red) catch infections or suffer from heart oedemas by 6 months. Only around 65% (n = 69/108) survive for more than 12 months without overt signs of infections. Fewer than 1% (n = 2/500) of wild-type fish (blue) exhibit such defects. The graph does not include deaths by other causes. d, e May-Grunwald/Wright-Giemsa staining in cytospins of haematopoietic cells isolated from the WKM of zebrafish adults: d wild-type; egata2aΔi4/Δi4 mutant. Note the decrease in cell numbers. f Cell counts of haematopoietic cells isolated from WKM of wild-type (n = 14) and gata2aΔi4/Δi4 mutants (n = 8). The gata2aΔi4/Δi4 mutants show a ~2-fold decrease in haematopoietic cell numbers in the WKM (μwt = 4.37 × 105; μmut = 2.37 × 105, p = 0.0185, Mann-Whitney test). (g) Number of neutrophils isolated from WKM of wild-type (n = 14) and gata2aΔi4/Δi4 mutants (n = 7). The gata2aΔi4/Δi4 mutants show a ~2-fold decrease in neutrophil numbers in the WKM (μwt = 2.17 × 105; μmut = 1.03 × 105, p = 0.0269, Mann-Whitney test). Error bars: median cell number ± SD. h, i Kidney smears from 9 months post-fertilization adult animals were assessed. h Wild-type shows various stages of lineage differentiation. i WKM smear; 1 of 10 gata2aΔi4/Δi4 mutants showed the presence of excess blasts with very little erythroid differentiation (98% blasts, >200 cells assessed). Scalebars: 2 mm (a, b) and 10 μm (d, e, h, i). See also Supplementary Fig.6.

Acknowledgments
This image is the copyrighted work of the attributed author or publisher, and ZFIN has permission only to display this image to its users. Additional permissions should be obtained from the applicable author or publisher of the image. Full text @ Commun Biol