|
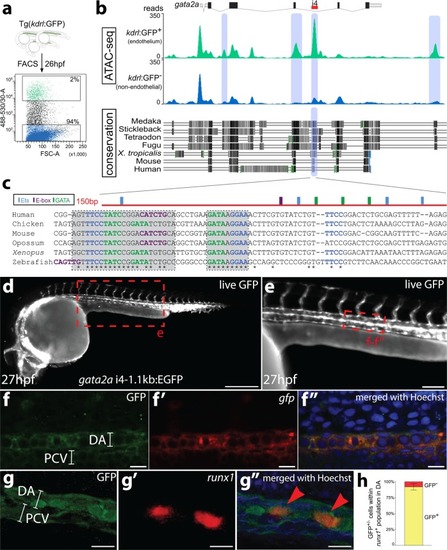
The i4 enhancer in the <italic>gata2a</italic> locus is conserved and drives pan-endothelial expression of a GFP reporter in zebrafish.aKdrl:GFP+ (green) and kdrl:GFP− (blue) cells were FACS-sorted from 26hpf embryos and used for preparation of ATAC-seq libraries. b The image of the mapped reads represents stacked means of two biological ATAC-seq replicates. Differential peak analysis identified four chromatin regions (blue shading) in the locus of gata2a that are significantly more open in the kdrl:GFP+ population (p < 0.0001). A region in the fourth intron (termed i4 enhancer) is conserved throughout vertebrates. Black and grey shading denotes regions of high conservation between the species analysed. c The highly conserved 150 bp region (red) contains putative transcription factor binding sites, mapped computationally. Light blue: Ets binding sites; purple: E-box binding sites; green: GATA binding sites; asterisks: conserved residues. d Widefield fluorescent image of a live Tg(gata2a-i4-1.1 kb:GFP) zebrafish embryo at 27hpf showing GFP fluorescence in the endothelial cells and in the heart (endocardium). e Higher magnification image of the trunk of the embryo from panel d. f–f″ Confocal images of a trunk fragment of a Tg(gata2a-i4-1.1 kb:GFP) embryo immunostained with anti-GFP antibody (f) and probed for gfp mRNA (f′) at 25hpf. f″ Merged images from panels f–f′ with Hoechst nuclear staining in blue, showing complete overlap of GFP protein and mRNA. g–g″ Confocal images of the dorsal aorta (DA) and posterior cardinal vein (PCV) of a Tg(gata2a-i4-1.1 kb:GFP) embryo immunostained with anti-GFP antibody (g) and probed for runx1 mRNA (g′) at 25hpf. See panel e for approximate position within the embryo. g″ Merged images from panels g–g’, also showing Hoechst nuclear staining in blue. h Counting of the runx1+ cells represented in panels g′–g″ in 25 embryos shows that >90% of runx1+ cells are also GFP+. N = 3. Error bars: ± SD. See also Supplementary Fig. 1.
|