IMAGE

Fig. 3

ID
ZDB-IMAGE-200306-62
Genes
Source
Figures for Dobrzycki et al., 2020
Image
Figure Caption

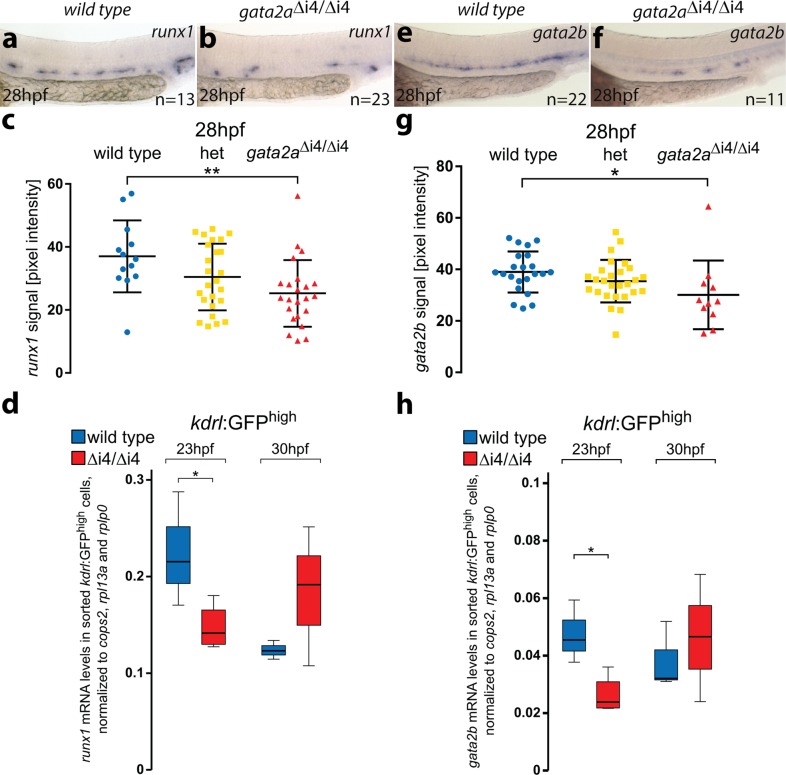
Fig. 3 Loss of <italic>gata2a</italic> expression in the endothelium of <italic>gata2a</italic><sup>Δi4/Δi4</sup> mutants leads to decreased levels of <italic>runx1</italic> and <italic>gata2b</italic> in the HE.

a, b In situ hybridization for runx1 expression in the HE of wild-type and gata2aΔi4/Δi4 embryos at 28hpf. c Quantification of the runx1 in situ hybridization signal from wild-type (blue), heterozygous gata2a+/Δi4 (het, yellow) and gata2aΔi4/Δi4 (red) siblings at 28hpf shows significant decrease in runx1 pixel intensity in the DA in the homozygous mutants compared to wild-type (µwt = 34.8, µmut = 25.3; F = 4.956, d.f. = 2, 58; ANOVA),**p < 0.01. n = 14, wild-type; n = 25, het; n = 23, gata2aΔi4/Δi4. Error bars: mean ± SD. d qRT-PCR on RNA isolated from the sorted kdrl:GFP+ cells shows decreased levels of runx1 mRNA in the endothelium of gata2aΔi4/Δi4 mutants at 23hpf (t = 2.585, d.f. = 5, p < 0.05) but not at 30hpf (t = 1.326, d.f. = 4, p > 0.2), compared to wild-type. N = 4 for gata2aΔi4/Δi4 at 23hpf, N = 3 for other samples. Note different scales of expression levels. *p < 0.05. e, fGata2b expression in the HE of wild-type and gata2aΔi4/Δi4 embryos at 28hpf. g Quantification of the gata2b mRNA signal, detected by in situ hybridization, from wild-type (blue), heterozygous gata2a+/Δi4 (het; yellow) and gata2aΔi4/Δi4 (red) siblings at 28hpf shows significant decrease in gata2b pixel intensity in the DA in the homozygous mutants compared to wild-type (µwt = 39, µmut = 30.1; F = 5.05, d.f. = 2, 54; ANOVA), *p < 0.05. n = 22, wild-type; n = 24, het; n = 11, gata2aΔi4/Δi4. Error bars: mean ± SD. h qRT-PCR in sorted kdrl:GFP+ cells showed decreased levels of gata2b mRNA in the endothelium of gata2aΔi4/Δi4 mutants at 23hpf (t = 3.334, d.f. = 5, p < 0.05) but not at 30hpf (t = 0.373, d.f. = 4, p > 0.7), compared to wild-type. N = 4 for gata2aΔi4/Δi4 at 23hpf, N = 3 for other samples. *p < 0.05. See also Supplementary Figs. 3 and 4.

Figure Data
Acknowledgments
This image is the copyrighted work of the attributed author or publisher, and ZFIN has permission only to display this image to its users. Additional permissions should be obtained from the applicable author or publisher of the image. Full text @ Commun Biol