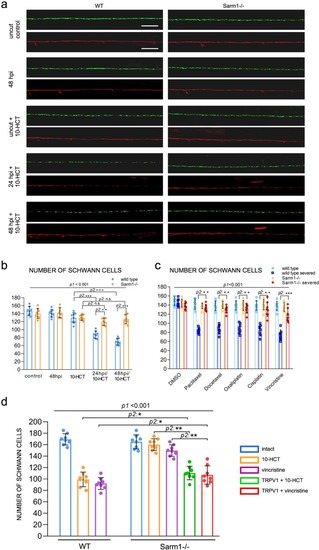
Functional conservation of Sarm1 in zebrafish.

a Structure Sarm1 indicating alignment of the Sarm1 functional domains from different species (not at scale). b Confocal image of axonal mitochondria marked with mito-mCherry in wild type and Sarm1−/−. Red arrows point to prominent mitochondrial groups in axons. c Upper panels, kymographs from videomicroscopic recording of axonal mitochondria in wild type (H) (left panel) and Sarm1−/− (I) (right panel). Lower panels show color-coded traces of moving mitochondria in anterograde (green) and retrograde (red) directions, taken from the kymographs shown in the upper panels. d Density of mitochondria in 5 dpf wild type and Sarm1−/−, error bar = SEM. n.s. = not significant, p value from Student’s t-test, n = 25 (WT), n = 19 (Sarm1−/−). e Mobility of the mitochondria in 5 dpf wild type and Sarm1−/−. Circles show the anterograde and triangles the retrograde movement of the mitochondria. p value from one-way ANOVA, wild type n = 26, Sarm1−/− n = 26. f Time-lapse images of axonal degeneration of GFP-labeled lateralis sensory neuron in wild type (left) and Sarm1−/− larvae (right). hpi = hour post-injury, scale bar = 50 μm, white asterisk indicates the regrowing axons from the proximal stump. g Quantification of the time from axon transection to fragmentation in wild type (n = 13) and Sarm1−/− (n = 13). h shows a recue experiment in which the expression of a functional Sarm1 in sensory neurons of Sarm1-mutant fish (right-hand side panels) suffices to degrade severed axons, similarly to wild-type fish (left-hand side panels). Middle panels show non-degradable Sarm1-deficient severed axons.

Sarm1 deficiency does not affect damage resolution.

a Quantification of the number of macrophages recruited to the injury site and adjacent axon segments. b Quantification of the time macrophages interact with axon segments. c Quantification of the size of debris within macrophages. One-way ANOVA was conducted firstly, then p values for T-test in between two individual group.

Loss of Sarm1 attenuates Ca<sup>2+</sup> influx to the axoplasm of severed axons, but not Ca<sup>2+</sup> uptake in mitochondria or the ER.

a Confocal image of a single lateralis sensory axon expressing the green-fluorescent calcium sensor GCaMP7a in wild type (left column) and Sarm1−/− fish (right column). Rows show that the same samples before laser-mediated transection (top), immediately after transection (middle), and 60 s after transection (bottom). In a, c, and e, white arrowheads indicate the position of the axon, specifically when signal-to-background is low. Scale bar 20 μm. b shows quantification of the first wave of axoplasmic calcium. Data are shown as mean ± SEM; p from one-way ANOVA, wild type n = 16, Sarm1−/− 16. c shows a confocal image of lateralis sensory axons expressing the red-fluorescent calcium sensor RGECO in wild type (left column) and Sarm1−/− fish (right column). Rows show that same samples before laser-mediated transection (top), immediately after transection (middle), and 60 s after transection (bottom). d Quantification mitochondrial calcium influx shows the strong and nearly identical elevation and decay in wild type and Sarm1−/− immediately after the cuts. Data are shown as mean ± SEM; p from one-way ANOVA, wild type n = 16, Sarm1−/− 16. e shows a confocal image of lateralis sensory axons expressing the green-fluorescent calcium sensor CCaMP3 targeted to the endoplasmic reticulum (ER) in wild type (left column) and Sarm1−/− fish (right column). Rows show that same samples before laser-mediated transection (top), immediately after transection (middle), and 60 s after transection (bottom). f Quantification ER calcium influx shows strong and statistically equal elevation and decay in wild type and Sarm1−/− after the cuts. Data are shown as mean ± SEM; p from one-way ANOVA, wild type n = 16, Sarm1−/− 16.

Sarm1 is necessary for late onset axoplasmic Ca<sup>2+</sup> influx in severed axons.

a Confocal image of a lateralis sensory axons expressing the mCherry (red) and green-fluorescent calcium sensor GCaMP7a (green) in wild-type fish. Rows show same axons 2, 4, 8, and 12 h after transection (hours post-injury = hpi). b Confocal image of lateralis sensory axons expressing the mCherry (red) and green-fluorescent calcium sensor GCaMP7a (green) in Sarm1−/− fish. Scale bar 20 μm.

Schwann cells develop normally in Sarm1-deficient zebrafish.

a Confocal images of a double-transgenic 5dpf larva showing Schwann cells marked by expression of GFP (green) under the control of the Tg[gSAGFF202A] Gal4 driver, and lateralis afferent neurons marked by expression of mCherry under the control of the SILL enhancer (red). Wild type (top), Sarm1 mutants (bottom). Scale bar 20 μm. b Images show the indicated time points after axon transection (hours post-injury = hpi) from a videomicroscopic recording of Schwann cells (green) and their interaction with axons (red) in wild type and Sarm1−/−. White arrowheads indicate Schwann cells engulfing axonal debris in the wild type. A white arrow indicates degradation-resistant axon segment in Sarm1−/−. Please note that the proximal axon stump in Sarm1−/− is not visible in these images because it is outside the focal plane.

Schwann cells are not essential for the maintenance of Sarm1-deficient sensory axons.

ac Images of mCherry-expressing (red) transected axons in wild type (a), Erbb2−/− mutants (b), and Sarm1−/−; ErBb2−/− double mutants (c). Scale bar 100 μm. d Quantification of transected axon fragmentation in Erbb2−/− and Sarm1−/−; ErBb2−/−. Error bar = SEM, p value from one-way ANOVA test, n = 15 (each group). e Image of from Supplementary Movie 1, showing the discrete local defasciculation of regenerated the sensory fiber (red) and the bridging of the glial gap by Schwann cells (green) in a wild-type specimen. f Equivalent experiment, taken from Supplementary Movie 2, showing a more pronounced local defasciculation of the regenerated the sensory fiber (red) in a Sarm1-mutant specimen. Note that the bridging of the glial gap does not occur.

Schwann cells maintain terminal phenotype in Sarm1-deficient zebrafish.

ac Schematic model of the confocal imaging locations on severed axons (a). Confocal images of wild type (b) and Sarm1−/− (c) specimens in 6, 10, and 24hpi. hpi hour post-injury. The specimens were the Tg[gSAGFF202A;UAS:EGFP; SILL:mCherry] lines and were stained with Claudin-k (magenta) antibody. Scale bar 50 μm.

The clearance of the severed axons is not essential for neuronal-circuit repair.

a, b Confocal images of wild type (a) and Sarm1−/− (b) specimens expressing EGFP in sensory neurons of the lateral line (green) and stained with the monoclonal antibody 6D2. Stainings were performed at indicated time points after axons severing (hpi). The arrows point to the cutting sites. Scale bar is 50 μm. c Live imaging of the Tg[Mbp-EGFP; SILL:mCherry] after severing. The arrows indicated the fragmented axons and the arrowheads the fragmented myelin. Scale bar 20 μm. d Live imaging of the Sarm1−/− in Tg[Mbp-EGFP; SILL:mCherry] after severing. Arrows indicate regrowing axons, and arrowheads indicate the juxtaposition between the regrowing axons. Scale bar 20 μm.

Loss of Sarm1 protects Schwann cells from chemical toxins.

a Confocal images showing Schwann cells (green) and lateralis sensory axons (red) in a control specimen (in which axons were not transected), in a specimen 48 h after axon transection, and in specimens treated with 10-HCT (10-hydroxycamptothecin). Left column is wild type and right column shows Sarm1−/−. In all cases, the concentration of 10-HCT in water was 40 μm. Scale bar 100 μm. b Quantification of the Schwann cells from a. Data are shown as mean ± SEM. **p < 0.01, two-way ANOVA, n = 8 (each group), followed by T-test for two individual group. c Quantification of Schwann cells of WT, WT severed, Sarm1−/− and Sarm1−/− severed with the treatment of the indicated chemical compounds for 48 h. Concentrations: Paclitaxel 40 μm, Docetaxel 0.1 μm, Oxaliplatin 500 μm, Cisplatin 50 μm, Vincristine 50 μm. Data are shown as mean ± SEM. *p < 0.05; **p < 0.01, three-way ANOVA, n = 8 (each group), followed by T-test for two individual group. d Quantification of Schwann cells after axon severing, in specimens treated with 10-HCT or Vincristine. The left bar group is wild type. The right bar group is Sarm1−/−, and Sarm1−/− with synthetically eliminated axon segments. Two-way ANOVA, followed by T-test for two individual groups.

ZFIN is incorporating published figure images and captions as part of an ongoing project. Figures from some publications have not yet been curated, or are not available for display because of copyright restrictions.

PHENOTYPE:
Fish:
Observed In:
Stage: Day 5
Acknowledgments
This image is the copyrighted work of the attributed author or publisher, and ZFIN has permission only to display this image to its users. Additional permissions should be obtained from the applicable author or publisher of the image. Full text @ Commun Biol