IMAGE

Fig. 1

ID
ZDB-IMAGE-200207-1
Source
Figures for Tian et al., 2020
Image
Figure Caption

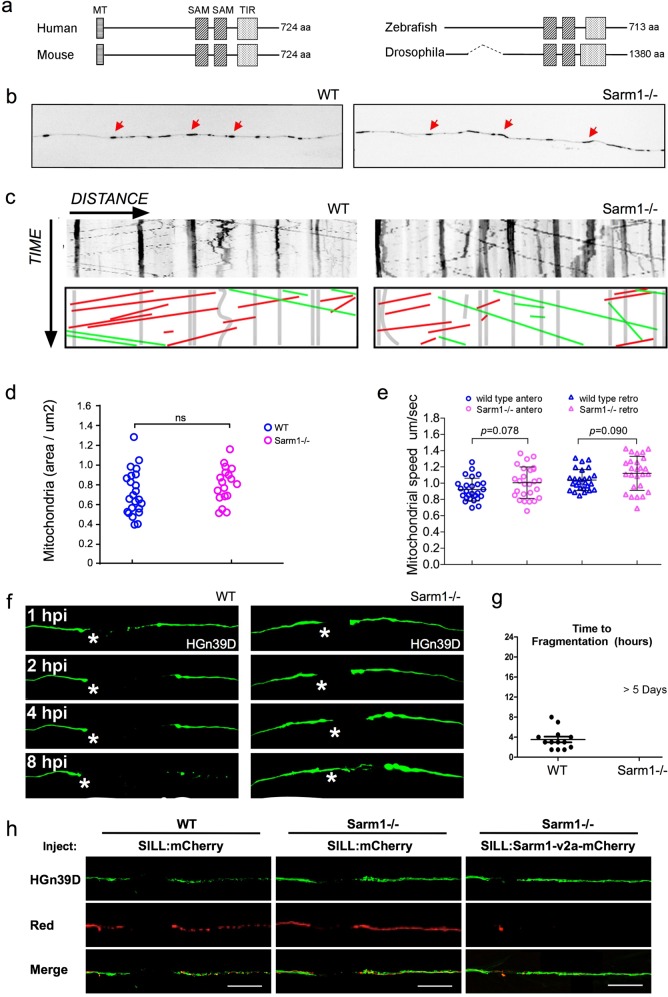
Fig. 1 Functional conservation of Sarm1 in zebrafish.

a Structure Sarm1 indicating alignment of the Sarm1 functional domains from different species (not at scale). b Confocal image of axonal mitochondria marked with mito-mCherry in wild type and Sarm1−/−. Red arrows point to prominent mitochondrial groups in axons. c Upper panels, kymographs from videomicroscopic recording of axonal mitochondria in wild type (H) (left panel) and Sarm1−/− (I) (right panel). Lower panels show color-coded traces of moving mitochondria in anterograde (green) and retrograde (red) directions, taken from the kymographs shown in the upper panels. d Density of mitochondria in 5 dpf wild type and Sarm1−/−, error bar = SEM. n.s. = not significant, p value from Student’s t-test, n = 25 (WT), n = 19 (Sarm1−/−). e Mobility of the mitochondria in 5 dpf wild type and Sarm1−/−. Circles show the anterograde and triangles the retrograde movement of the mitochondria. p value from one-way ANOVA, wild type n = 26, Sarm1−/− n = 26. f Time-lapse images of axonal degeneration of GFP-labeled lateralis sensory neuron in wild type (left) and Sarm1−/− larvae (right). hpi = hour post-injury, scale bar = 50 μm, white asterisk indicates the regrowing axons from the proximal stump. g Quantification of the time from axon transection to fragmentation in wild type (n = 13) and Sarm1−/− (n = 13). h shows a recue experiment in which the expression of a functional Sarm1 in sensory neurons of Sarm1-mutant fish (right-hand side panels) suffices to degrade severed axons, similarly to wild-type fish (left-hand side panels). Middle panels show non-degradable Sarm1-deficient severed axons.

Figure Data
Acknowledgments
This image is the copyrighted work of the attributed author or publisher, and ZFIN has permission only to display this image to its users. Additional permissions should be obtained from the applicable author or publisher of the image. Full text @ Commun Biol