FIGURE SUMMARY
Title

Imaging epilepsy in larval zebrafish

Authors
Burrows, D.R.W., Samarut, É., Liu, J., Baraban, S.C., Richardson, M.P., Meyer, M.P., Rosch, R.E.
Source
Full text @ Eur. J. Paediatr. Neurol.

Calcium imaging of larval zebrafish.

(A) A single axial plane from live two-photon imaging of a larval zebrafish brain is shown at 7 days post fertilisation on the left. On the right, sagittal and coronal views of a reference image [http://www.zbbrowser.com] [90] are shown to illustrate the 3D location of different brain areas. A zebrafish larva (not to scale) is shown at the bottom of the panel. (B) Example time series data are shown for regional averages of gross anatomical brain regions, as well as example cells identified in each area.

Example of bifurcation behaviour of a set of coupled oscillators.

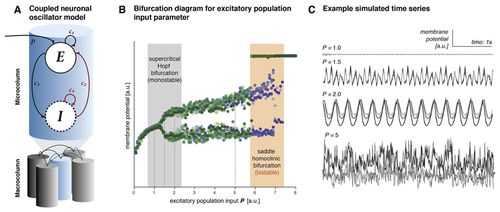
(A) Multiple Wilson-Cowan type neural mass models of excitatory and inhibitory populations were heterogeneously coupled and simulated at different values of excitatory population input P [112]. (B) This graph shows the membrane potential for five coupled microcolumns at steady state for different values of excitatory population input P, with dots of different shades representing a single microcolumn. Stepwise changes in P cause transitions in dynamics from fixed point steady states (shown as single dot per value P) to oscillatory states (shown as peak and trough of the oscillation for each value of P for P > 1.3) and back to fixed point (for P > 7.4). Simulations were run in small increasing (blue), and decreasing (green) steps, revealing bistability in the offset of the oscillation (note that outside of this bistability blue and green are largely overlapping). Even in this simplistic model many different state transition phenomena can be modelled, as sudden switches between high amplitude oscillations and fixed points at the bistable offset bifurcation, where two possible steady states co-exist. (C) Time series examples are shown for increasing values of the parameter P for illustration of different dynamic regimes associated with changes in just the single parameter P. (For interpretation of the references to colour in this figure legend, the reader is referred to the Web version of this article.)

Whole-brain state transition after PTZ exposure.

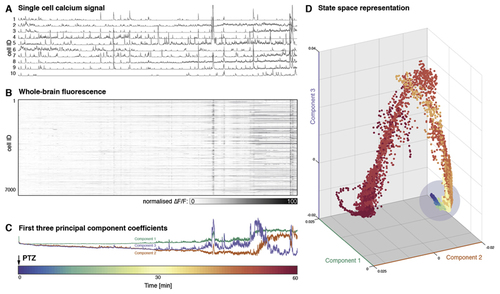
(A) Example normalised fluorescence traces are shown for individual neurons for 1 h after addition of PTZ to the bath at time point 0 showing an increase of amplitude and frequency of neuronal firing events. (B) Firing of all >7000 active cells captured in this recording. (C) First three principal components over time varying fluorescence matrix shown in (B). These indicate both a persistent drift in components 2, and 3, as well as drastic changes in the loading of all components towards the end of the recording. (D) The same data is shown as a state space plot. Whilst most of the data points exist in a restricted region/state (indicated by blue circle), the late seizure is characterised by very different activity distribution readily apparent in this low-dimensional projection as points outside of the earlier range.

(Time scale for all figures shown as colour bar at the bottom of the figure). (For interpretation of the references to colour in this figure legend, the reader is referred to the Web version of this article.)

Increases in neural whole-brain neuronal synchrony during PTZ-induced seizures.

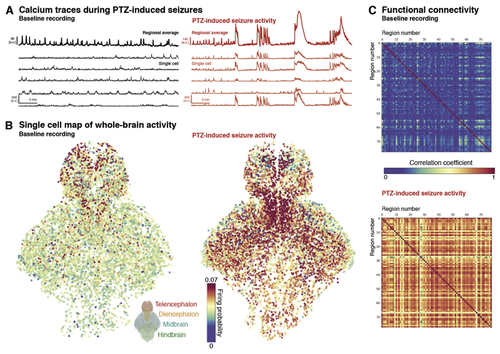
(A) Example normalised fluorescence traces are shown as whole brain mean traces and examples of individual neurons at baseline (black) and PTZ-induced seizure (red) conditions (note the difference in amplitude scale). (B) Map of individual cell firing probabilities across the two conditions demonstrates an increase in firing probability in the PTZ-induced seizure condition, with regional heterogeneity across the larval fish brain. (C) Between-region functional connectivity shown as correlation matrix. Segmented cells were registered to a zebrafish brain atlas and then averaged, to measure correlation between major brain regions (>70) across baseline and PTZ conditions. (For interpretation of the references to colour in this figure legend, the reader is referred to the Web version of this article.)

Microcircuit model of tectal microcircuits during PTZ-induced epileptic seizures.

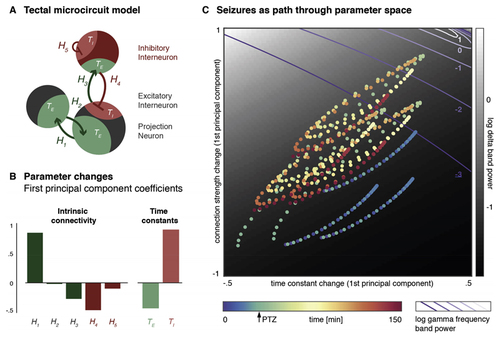
(A) Coupling parameters (time constants T and coupling strengths H) of a neuronal oscillator model were fitted to calcium imaging traces during induced epileptic seizures in larval zebrafish. (B–C) parameter values at different time points are plotted on two-dimensional projection. At each point of this two-dimensional space, model parameters can be used to simulate expected features of oscillatory (shown here in for delta-band oscillatory power as background grey scale map, and gamma-band oscillatory power as isoclines). This mapping between model parameters and predicted neuronal activity identifies key changes in parameters associated with PTZ exposure and seizure activity. Similar approaches may highlight regions in parameter space that are close to state transition points and render the brain more likely to display seizure activity.

Figure reproduced with permission from Ref. [93].

Acknowledgments
This image is the copyrighted work of the attributed author or publisher, and ZFIN has permission only to display this image to its users. Additional permissions should be obtained from the applicable author or publisher of the image. Full text @ Eur. J. Paediatr. Neurol.