
|
Fig. 3
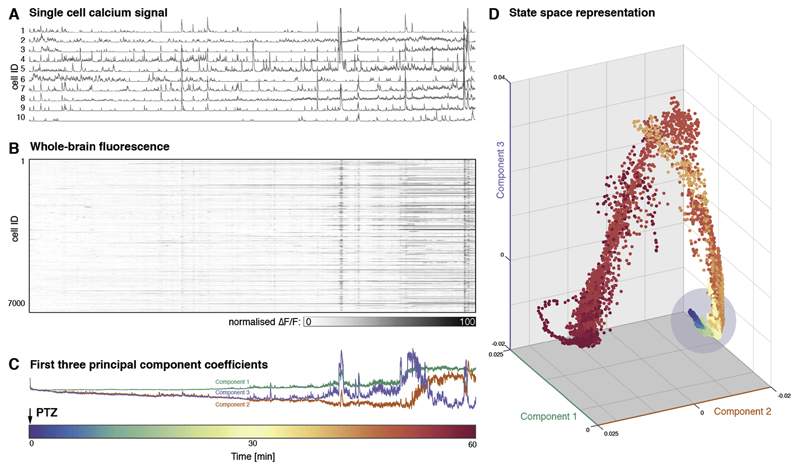
(A) Example normalised fluorescence traces are shown for individual neurons for 1 h after addition of PTZ to the bath at time point 0 showing an increase of amplitude and frequency of neuronal firing events. (B) Firing of all >7000 active cells captured in this recording. (C) First three principal components over time varying fluorescence matrix shown in (B). These indicate both a persistent drift in components 2, and 3, as well as drastic changes in the loading of all components towards the end of the recording. (D) The same data is shown as a state space plot. Whilst most of the data points exist in a restricted region/state (indicated by blue circle), the late seizure is characterised by very different activity distribution readily apparent in this low-dimensional projection as points outside of the earlier range.
(Time scale for all figures shown as colour bar at the bottom of the figure). (For interpretation of the references to colour in this figure legend, the reader is referred to the Web version of this article.)