
|
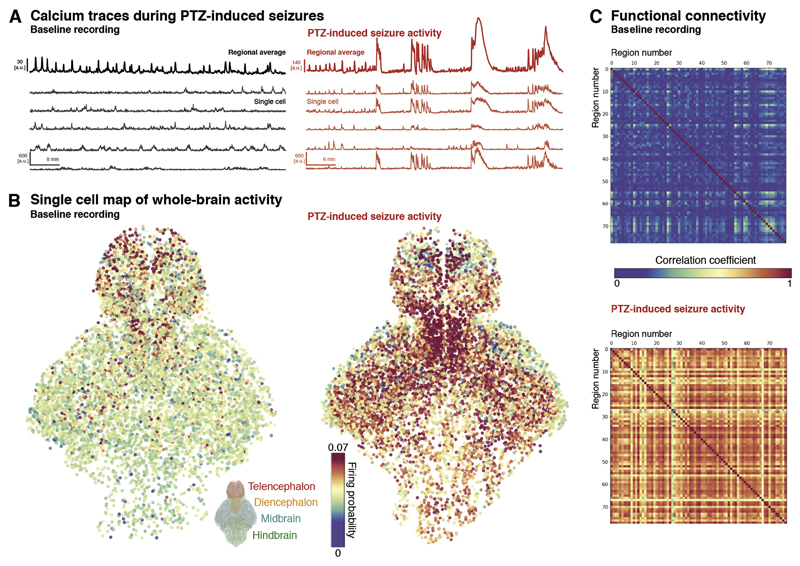
Fig. 4
(A) Example normalised fluorescence traces are shown as whole brain mean traces and examples of individual neurons at baseline (black) and PTZ-induced seizure (red) conditions (note the difference in amplitude scale). (B) Map of individual cell firing probabilities across the two conditions demonstrates an increase in firing probability in the PTZ-induced seizure condition, with regional heterogeneity across the larval fish brain. (C) Between-region functional connectivity shown as correlation matrix. Segmented cells were registered to a zebrafish brain atlas and then averaged, to measure correlation between major brain regions (>70) across baseline and PTZ conditions. (For interpretation of the references to colour in this figure legend, the reader is referred to the Web version of this article.)