
- Title
-
Mcidas mutant mice reveal a two-step process for the specification and differentiation of multiciliated cells in mammals
- Authors
- Lu, H., Anujan, P., Zhou, F., Zhang, Y., Chong, Y.L., Bingle, C.D., Roy, S.
- Source
- Full text @ Development
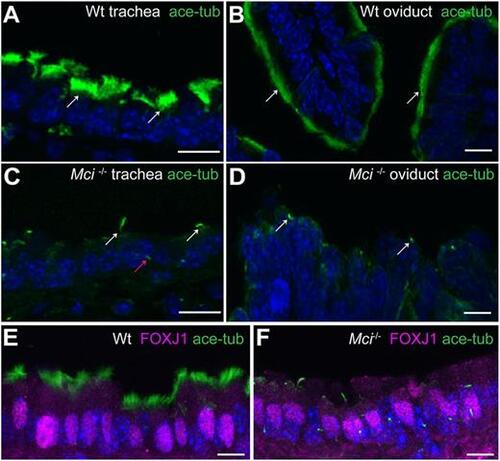
MCCs in Mci mutant mice differentiate a single cilium and express FOXJ1. (A) Wild-type trachea section showing multiple cilia on MCCs (arrows). (B) Wild-type oviduct section showing multiple cilia on MCCs (arrows). (C) Mci mutant trachea section showing cells with a single cilium (white arrows). A primary cilium in a neighboring cell is indicated (red arrow). (D) Mci mutant oviduct section showing cells with a single cilium (arrows). (E) Nuclear-localized FOXJ1 expression in MCCs of wild-type trachea. (F) Nuclear-localized FOXJ1 expression in monociliated cells of Mci mutant trachea. In all preparations, cilia were stained using anti-acetylated tubulin antibodies (green) and nuclei with DAPI (blue). Wt, wild type. Scale bars: 10 μm. For all histological data in this and subsequent figures, tissues from at least two wild-type and three Mci mutant mice were analyzed unless mentioned otherwise. |
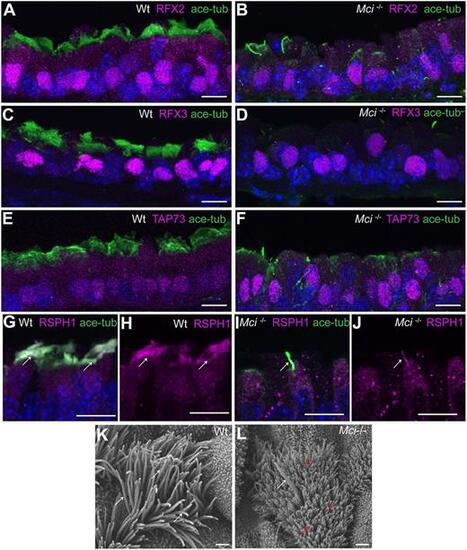
Mci mutant MCC precursors express a suite of ciliary transcription factors and their single cilium localizes motile cilia-specific proteins. (A) Nuclear-localized RFX2 expression in MCCs of wild-type trachea. (B) Nuclear-localized RFX2 expression in monociliated cells of Mci mutant trachea. (C) Nuclear-localized RFX3 expression in MCCs of wild-type trachea. (D) Nuclear-localized RFX3 expression in monocilated cells of Mci mutant trachea. (E) Nuclear-localized TAP73 expression in MCCs of wild-type trachea. (F) Nuclear-localized TAP73 expression in monociliated cells of Mci mutant trachea. (G) RSPH1 colocalization with acetylated tubulin to MCC cilia of wild-type trachea (arrows). (H) RSPH1 localization to MCC cilia of wild-type trachea (arrows; display of only RPSH1 staining from G). (I) RSPH1 colocalization with acetylated tubulin to a single cilium of Mci mutant trachea (arrow). (J) RSPH1 localization to single cilium of Mci mutant trachea (arrow; display of only RSPH1 staining from I). (K) SEM analysis of a wild-type tracheal MCC showing multiple cilia (arrows). (L) SEM analysis of Mci mutant MCCs with a single cilium (white arrow). The microvilli, which are longer in the MCCs and normally remain obscured by the multiple cilia, are indicated (red arrows). One wild-type and one mutant trachea were scanned by SEM. The single-cilium phenotype of the Mci mutant trachea is representative of several fields of view scanned by SEM. In all preparations, cilia were stained using anti-acetylated tubulin antibodies (green) and nuclei with DAPI (blue). Scale bars: 10 μm in A-J; 5 µm in K,L. |
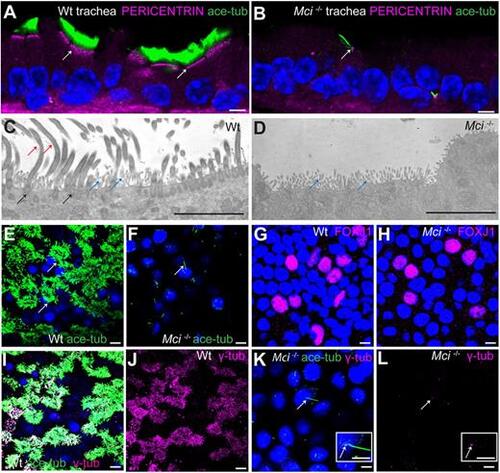
Mci mutant MCC precursors are unable to generate multiple basal bodies. (A) A wild-type trachea section showing apically aligned multiple basal bodies in MCCs (arrows; stained using anti-pericentrin antibodies). (B) Section of Mci mutant trachea showing single basal body in monociliated cells (arrows). (C) TEM image showing multiple basal bodies (black arrows) and cilia (red arrows) in a wild-type MCC. Microvilli are also indicated (blue arrows). (D) TEM image showing lack of multiple basal bodies and cilia in a Mci mutant MCC. Microvilli are indicated (blue arrows). Five sections each from two independent wild-type and mutant tracheae were sampled, and the cells were examined from the basal to the apical end. We did not find any evidence of undocked basal bodies in the cytoplasm of Mci mutant cells. (E) Wild-type MCCs differentiated in ALI culture with multiple cilia (arrows). (F) Mci mutant airway cells differentiated in ALI culture with a single cilium (arrow). (G) Wild-type airway cells differentiated in ALI culture showing nuclear FOXJ1 expression. (H) Mci mutant airway cells differentiated in ALI culture showing nuclear FOXJ1 expression. (I) Wild-type MCCs differentiated in ALI culture with multiple basal bodies (stained with anti-γ-tubulin antibodies) and multiple cilia. (J) Display of only γ-tubulin staining from I. (K) Mci mutant cells differentiated in ALI culture with a single basal body (arrow) and a single cilium. Inset shows a single cilium and basal body (arrow). (L) Display of only γ-tubulin staining from K showing a single basal body (arrow). Inset shows a single basal body (arrow). In preparations shown in A,B,E,F,I,K, cilia were stained using anti-acetylated tubulin antibodies (green) and nuclei were stained with DAPI (blue). Scale bars: 5 μm. ALI cultures were carried out in three independent biological replicates. |
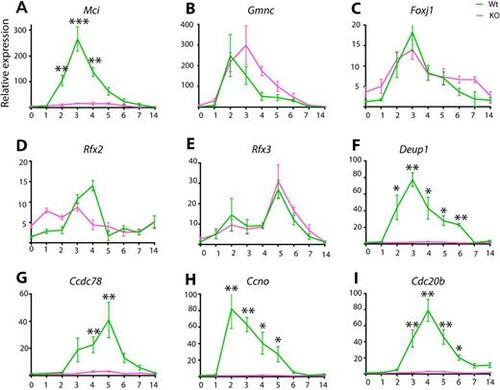
RT-qPCR analysis of ciliary transcription factor and DD pathway gene expression levels between wild-type and Mci mutant airway cells in ALI culture. (A-I) Relative expression levels are plotted on the y-axis, and days in ALI culture are plotted on the x-axis. KO, Mci mutant. Data are mean±s.e.m. Analysis was carried out on three independent biological replicates. *P<0.05; **P<0.01; ***P<0.001. |
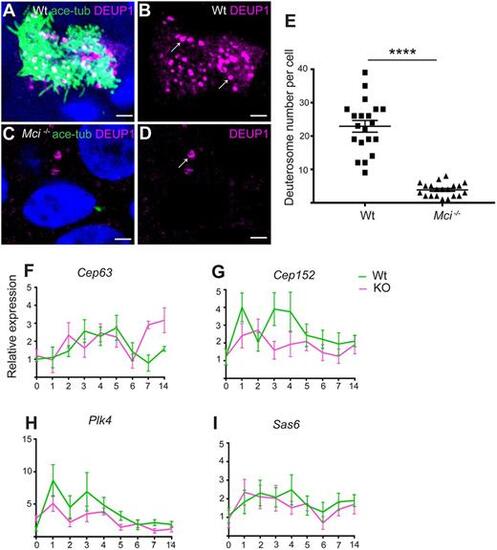
In Mci mutants, the DD pathway for basal body production is strongly affected but not the MCD pathway. (A) ALI cultured wild-type MCCs showing DEUP1-positive deuterosomes. (B) Display of only DEUP1 staining from A, showing deuterosomes (arrows). (C) ALI-cultured Mci mutant airway cells showing DEUP1-positive deuterosomes. (D) Display of only DEUP1 staining from C, showing a deuterosome (arrow). Scale bars: 5 μm. (E) Quantification of the numbers of DEUP1+ deuterosomes in differentiating wild-type and Mci mutant MCCs under ALI conditions. Twenty cells were counted for each genotype at ALI day 3. ****P≤0.0001. (F-I) RT-qPCR analysis of MCD pathway gene expression levels between wild-type and Mci mutant airway cells in ALI culture. Relative expression levels are plotted on the y-axis, and days in ALI culture on the x-axis. Data are mean±s.e.m. Analysis was carried out on three independent biological replicates. |
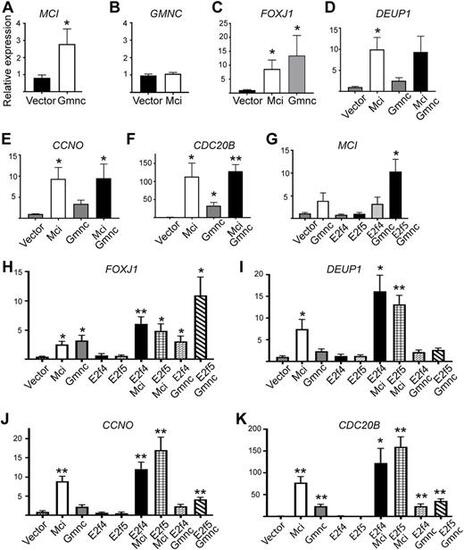
RT-qPCR analysis of ciliary transcription factor and DD pathway gene expression levels in response to overexpression of MCI, GMNC and E2F proteins in HEK293T cells. (A-K) Relative expression levels are plotted on the y-axis; overexpression conditions are indicated on the x-axis. Data are mean±s.e.m. Analysis was carried out on three independent biological replicates. *P≤0.05, **P≤0.01. |
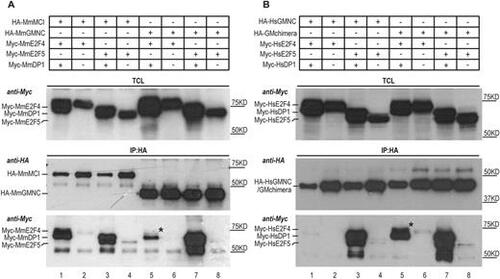
Differential interaction of MCI and GMNC with E2F4 and E2F5. (A) Co-immunoprecipitation experiments using mouse (Mm, Mus musculus) proteins show that MCI effectively interacted with both E2F4 and E2F5 in the presence of DP1 (lane 1, IP panel, anti-Myc blot); very little E2F4 co-precipitated with GMNC and DP1 (lane 5, IP panel, anti-Myc blot). The weak presence of E2F4 in the GMNC IP is marked by the black asterisk. (B) The C-terminal domain of MCI accounts for effective interaction with both E2F4 and E2F5. GMNC showed minimal interaction with E2F4 (lane 1, IP panel, anti-Myc blot). In comparison, the GM (engineered by replacing the C-terminal domain of GMNC with that of MCI) chimera could co-precipitate with both E2F4 and E2F5, in the presence of DP1 (lane 5 and 7, IP panel, anti-Myc blot). The black asterisk marks the E2F4 band that is absent in lane 1 (IP panel, anti-Myc blot). Human (Hs, Homo sapiens) proteins were used for this experiment. The E2F and DP1 proteins were tagged N terminally with the Myc epitope, and the GMNC and MCI proteins were tagged N terminally with the HA epitope. TCL, total cell lysate; IP, immunoprecipitation. Data are representative of two independent biological replicates. |
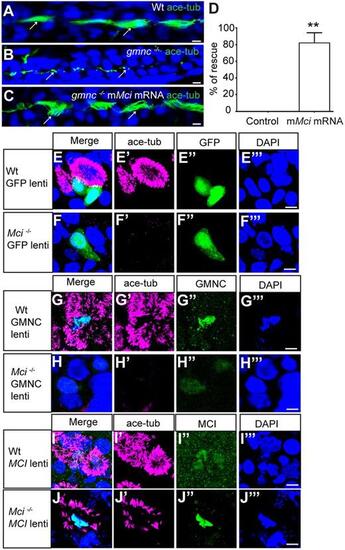
MCI can substitute for GMNC activity, but not vice versa, in MCC differentiation. (A) Pronephric duct of a 48 h post-fertilization (hpf) wild-type zebrafish embryo showing multiple cilia on MCCs (arrows). (B) Pronephric duct of a 48 hpf gmnc mutant zebrafish embryo showing severe lack of MCCs. Monocilia, which are not affected by the loss of Gmnc, are indicated (arrows). (C) Pronephric duct of a 48 hpf gmnc mutant embryo showing rescue of MCCs (arrows) on overexpression of mouse Mci (mMci) mRNA. (D) Quantification of the rescue of gmnc homozygous mutant zebrafish embryos with mMci mRNA. Seventy-two embryos overexpressing mouse MCI were genotyped. Seventeen were gmnc homozygotes, of which 14 showed MCC rescue in pronephric ducts (partial to full rescue in one or both ducts). Control represents an uninjected embryo. **P≤0.01. (E) Lentivirus-mediated overexpression of GFP in wild-type airway cell ALI culture does not affect MCC differentiation (E′-E‴ show individual channels). (F) Overexpression of GFP in Mci mutant airway cell ALI culture does not restore MCC differentiation (F′-F‴ show individual channels). (G) Overexpression of GMNC in wild-type airway cell ALI culture induces supernumerary MCC differentiation (G′-G‴ show individual channels). (H) Overexpression of GMNC in Mci mutant airway cell ALI culture does not rescue MCC differentiation (H′-H‴ show individual channels). (I) Overexpression of MCI in wild-type airway cell ALI culture induces supernumerary MCC differentiation (I′-I‴ show individual channels). (J) Overexpression of MCI in Mci mutant airway cell ALI culture rescues MCC differentiation (J′-J‴ show individual channels). In all preparations, cilia were stained with anti-acetylated tubulin antibodies (green in A-C; magenta in D-I) and nuclei with DAPI (blue). Overexpressed GFP, and GMNC and MCI were detected with anti-GFP and anti-HA antibodies (green in D-I). Lentivirus-mediated overexpression of GFP, MCI and GMNC in ALI cultures represents two independent biological replicates. Scale bars: 5 μm. PHENOTYPE:
|