FIGURE SUMMARY
Title

An interhemispheric neural circuit allowing binocular integration in the optic tectum

Authors
Gebhardt, C., Auer, T.O., Henriques, P.M., Rajan, G., Duroure, K., Bianco, I.H., Del Bene, F.
Source
Full text @ Nat. Commun.

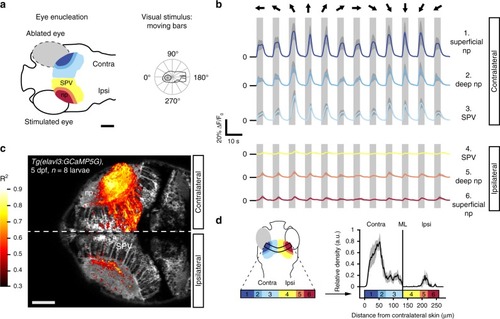
Visually evoked activity in the deep neuropil of the tectal hemisphere ipsilateral to the visually stimulated eye. a Optic tecta of 5 days-post-fertilization (dpf) larvae expressing GCaMP5G were imaged after monocular enucleation at 3–4 dpf. The remaining eye was visually stimulated with moving bars running across the larva’s field of view (bar width: 9°, speed: 20° s−1, direction: randomly chosen from 12 angular directions 30° apart for each individual stimulus presentation interval, see polar plot inset). Scale bar = 100 μm (np: tectal neuropil, SPV: stratum periventriculare). b Average fluorescence modulations of all voxels in six anatomically identified zones during visual stimulation with moving bars (n = 8 larvae, color code: 1. dark blue = superficial contralateral neuropil, 2. blue = deep contralateral neuropil, 3. light blue = contralateral SPV, 4. yellow = ipsilateral SPV, 5. orange = deep ipsilateral neuropil, 6. red = superficial ipsilateral neuropil, dark gray shading indicates the 95% confidence intervals, light gray vertical bars indicate the stimulus interval). In addition to the expected stimulus-synchronized activity in the tectal hemisphere contralateral to the stimulated eye, visually evoked activity was also observed in the neuropil of the ipsilateral tectum. Moving bar directions for each stimulus presentation interval are indicated by black arrows above the traces with respect to a larva’s orientation as shown in the polar plot inset in a. Source data are provided as Source Data File. c Highly stimulus-correlated voxels (R2 > 0.4) were found in the tectal hemisphere contralateral to the stimulated eye, consistent with direct contralateral retinal input. However, stimulus-correlated voxels were also observed in the ipsilateral tectal hemisphere, which in this experiment does not receive any direct retinal input due to eye enucleation. Scale bar = 50 μm. Source data are provided as Source Data File. d The average density projection of voxels (calculated as the mean over the short axis of the curved rectangle in the left panel) that are highly correlated with a moving bar stimulus (R2 > 0.4, as in c shows an enrichment in the tectal hemisphere contralateral to the stimulated eye and in the deep ipsilateral neuropil. Anatomical regions were color-coded as in a and b (n = 8 larvae, gray shading indicates the 95% confidence interval, np: tectal neuropil, SPV: stratum periventriculare, ML: midline).

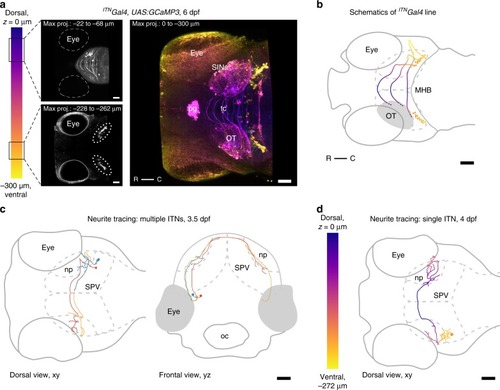
Intertectal neurons connect the two hemispheres of the optic tectum. a Maximum intensity projections of an ITNGal4 transgenic larva viewed dorsally at 6 dpf in which neurons that connect the two hemispheres of the optic tectum (intertectal neurons, ITNs) are labeled (most dorsal plane through the larva is indicated by z = 0 µm). The cell bodies of ITNs are situated in two bilateral symmetric nuclei below the respective tectal lobes (ITN nuclei highlighted by dotted ellipses in lower left panel) and send their axons dorsally through the tectum crossing the tectal commissure in ladder-like trajectories (upper left panel). In addition to labeling ITNs in the mesencephalic tegmentum, Gal4 is also expressed in the pineal gland, SINs, scattered periventricular neurons (PVNs), and the spinal cord in this transgenic line. All scale bars = 50 μm. (pg: pineal gland, tc: tectal commissure, OT: optic tectum, R: rostral, C: caudal, SINs: superficial interneurons). b Schematic of the transgenic ITNGal4 line depicted in a. ITN cell bodies and axon tracts are color-coded according to the position in the dorsoventral z-plane. To increase readability only the right ITN’s connectivity with respect to the larva is shown. Scale bar = 50 μm. (MHB: midbrain-hindbrain boundary, OT: optic tectum, R: rostral, C: caudal). c Neurite tracing of multiple ITNs in a larva at 3.5 dpf. At 3.5 dpf ITN neurites start to cross the midline (e.g., the blue ITN). In addition, ITNs begin to form arbors at the boundaries between the deep layers of the neuropil and the PVN layer. Scale bar = 50 μm. (oc: mouth/oral cavity, np: tectal neuropil, SPV: stratum periventriculare). Color-coded to simplify distinction between single ITNs. d Neurite tracing of a representative ITN at 4 dpf, color-coded according to the position in the dorsoventral z-plane (most dorsal plane of the larva is indicated by z = 0 µm). ITN axons cross the midline superficially and form arborization patterns of increasing complexity in the ipsi- and contralateral neuropil structures of the optic tectum. Scale bar = 50 μm. (np: tectal neuropil, SPV: stratum periventriculare).

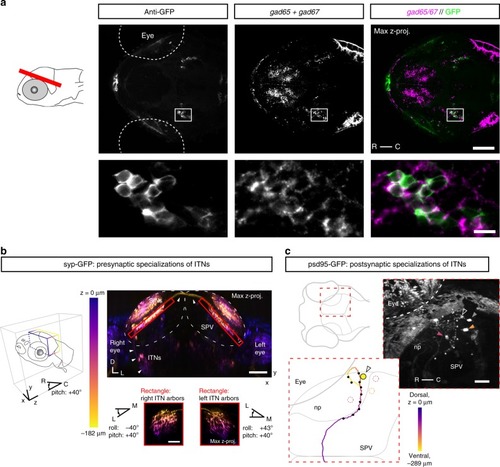
Intertectal neurons are GABAergic interneurons and form pre- and post-synaptic specializations in the OT. a Expression of gad65/gad67 and anti-GFP immunoreactivity in the brain of a 4 dpf ITNGal4, UAS:GCaMP3 larvae (red bar in larva to the left indicates microscopic plane, scale bar = 50 μm). Two bilateral symmetric ITN nuclei are labeled by anti-GFP (left nucleus enlarged and shown in the lower images, scale bar = 10 μm). b Maximum intensity projection through the OT of a 5 dpf ITNGal4, UAS:GCaMP3, UAS:Syp-GFP) larva (view from the front and below of the larva). Syp-GFP signal is color-coded according to depth along z. Pre-synaptic specializations of ITNs (Syp-GFP puncta, red rectangles) are in the deep neuropil ipsi- and contralaterally to the ITN cell bodies. Small panels: maximum intensity projections of the pre-synaptic specializations of ITNs viewed dorso-laterally (larva first rotated along the roll axis by −40° for right ITN arbors or along the roll axis by 43° for left ITN arbors, then rotated along the larval pitch axis by +40°, color code according to depth in z). White arrows indicate the ITN axon tract. Syp-GFP-labeled puncta in upper layers of the tectal neuropils belong to superficial interneurons (SINs) in the SO and SFGS54. All scale bars = 50 μm. c Postsynaptic specializations labeled in a 3 dpf ITNGal4 UAS:GCaMP3 larva, transiently expressing UAS:psd-95-GFP. Right panel shows a maximum intensity projection viewed dorsally through the right OT (skin autofluorescence partially removed). A single ITN was labeled in this larva (cell body indicated by open white arrow) and locations of puncta with strong psd-95-GFP expression are indicated by white asterisks along the ITN neurite. The ITN was traced and its trajectory color-coded according to the position in the dorsoventral z-plane (lower-left inset). Black dots along the neurite indicate the positions of psd-95-GFP puncta. Post-synaptic specializations of ITNs were found predominantly in the deep layers of the tectal neuropil ipsilateral to the ITN cell body. Periventricular neuron cell bodies (PVNs) were sometimes labeled in ITNGal4 larvae (dotted circles or filled arrows color-coded according to their z-position in right panel). Scale bar = 30 μm. (np: tectal neuropil, R: rostral, C: caudal, D: dorsal, L: left, SO: stratum opticum, SFGS: stratum fibrosum et griseum superficiale, SPV: stratum periventriculare).

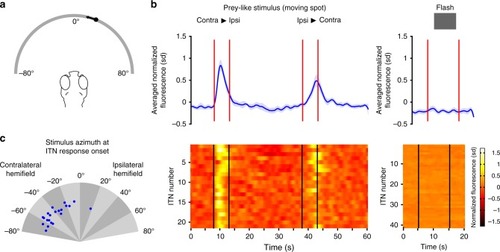
ITNs display visual sensory responses to prey-like moving target stimuli. a Schema of the virtual hunting assay. 5–6 dpf ITNGal4, UAS:GCaMP3 larvae were tethered in agarose with their eyes free to move. Small moving spots (size: 5°, speed: 30° s−1) moving horizontally from right to left or vice versa were projected on a curved screen covering ~160° of visual space. At the same time, a 2-photon microscope was used to record fluorescent calcium signals in ITNs in response to the visual stimuli as well as eye kinematics using an infrared imaging camera. b ITN cell bodies showed strong Ca-transient modulations in response to moving spots (stimulus intervals indicated by the red/black vertical lines, n = 21 ITNs from five larvae) whereas ITNs did not respond to flashes (n = 41 ITNs from three larvae). Traces show mean normalized fluorescence intensities with 95% confidence intervals. Source data are provided as Source Data File. c Azimuth of moving spots at the onset of the response of each ITN to visual prey-like stimuli. ITNs collectively respond to moving spots spanning almost the whole contralateral visual hemifield (n = 21 ITNs from five larvae). Source data are provided as Source Data File.

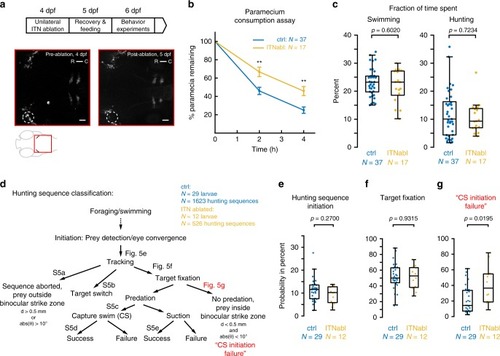
ITNs are required for the initiation of capture swims when prey is positioned in the binocular strike zone. a Experimental design for ablations and subsequent behavioral tracking. 12–26 ITNs were unilaterally laser-ablated in 4 dpf ITNGal4, UAS:GCaMP3 larvae, left to recover and fed with paramecia on 5 dpf. Behavior experiments were performed at 6 dpf. ITN-ablated ITNGal4, UAS:GCaMP3 larvae were imaged at 4 dpf (lower panels, pre-ablation) and again at 5 dpf (post-ablation). Dotted ellipse indicates ablated cells. Scale bars = 25 μm. b Paramecium consumption for control (n = 34 non-ablated larvae and n = 3 sham-ablated larvae) and ITN-ablated larvae (n = 17 larvae, 12–26 ITNs ablated). ITN-ablated larvae consume paramecia at a reduced rate compared with control larvae (percentage of remaining paramecia relative to the number of paramecia at t = 0 h, whiskers denote 95% confidence intervals, Mann–Whitney U-test, t = 2 h: p = 0.0036, t = 4 h: p = 0.0013). c Fraction of time spent swimming and time spent hunting for control (n = 37) and ITN-ablated (n = 17) larvae (Mann–Whitney U-test, swimming: median (ctrl) = 23.2%, median (ITNabl) = 23.2%, p = 0.6020//hunting: median (ctrl) = 10%, median (ITNabl) = 9.3%, p = 0.7234). d Schematic illustrating classification of individual hunting sequences. Figure references refer to the respective panels in Fig. 5 and Supplementary Fig. 5. In total, 1623 hunting sequences from 29 control larvae and 526 hunting sequences from 12 ITN-ablated larvae were analyzed. e ITN-ablated larvae initiate hunting with comparable probability to control larvae (control: median hunting sequence initiation probability = 11.6 %, ITN-ablated: median hunting sequence initiation probability = 10.2%, Mann–Whitney U-test, p = 0.2700). f ITN-ablated larvae fixate targets with a comparable probability to control larvae (control: median target fixation probability = 50.0%, ITN-ablated: median target fixation probability = 52.7%, Mann–Whitney U-test, p = 0.9315). g ITN-ablated larvae initiate capture swims at lower probability when prey is positioned in the binocular strike zone (prey at <0.5 mm distance, ±10° azimuth) compared with controls (Mann–Whitney U-test, p = 0.0195, control: median failure rate = 14.3 %, ITN-ablated: median failure rate = 36.5 %). Central marks of boxplots indicate the respective median. Bottom and top edges correspond to 25th and 75th percentiles. Source data for Fig. 5b–g are provided as Source Data File.

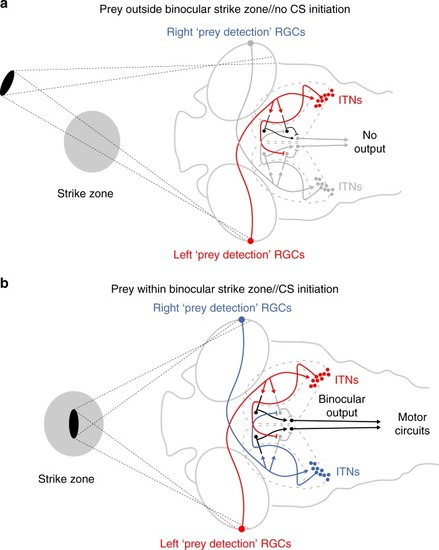
Model circuit for the integration of binocular visual input to localize prey and initiate capture swims. a Prey located outside the strike zone will at most activate the trigger zone of just one eye. RGCs transmit visual information to the contralateral OT and contralateral ITNs. ITNs in turn cross the midline to convey visual information to the opposite OT. In this case, local inhibitory interneurons in the oppposite OT prevent a capture swim from being triggered. b When prey is positioned inside the binocular strike zone, both trigger zones are activated. Thus, each tectum receives direct contralateral retinal input, as well as indirect, ITN-mediated input carrying information from the ipsilateral eye. The coincidence of excitatory drive and disinhibition, respectively, allows a premotor command to be generated to initiate a capture swim.

Acknowledgments
This image is the copyrighted work of the attributed author or publisher, and ZFIN has permission only to display this image to its users. Additional permissions should be obtained from the applicable author or publisher of the image. Full text @ Nat. Commun.