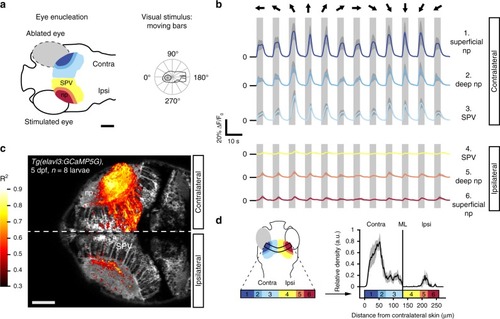
Visually evoked activity in the deep neuropil of the tectal hemisphere ipsilateral to the visually stimulated eye. a Optic tecta of 5 days-post-fertilization (dpf) larvae expressing GCaMP5G were imaged after monocular enucleation at 3–4 dpf. The remaining eye was visually stimulated with moving bars running across the larva’s field of view (bar width: 9°, speed: 20° s−1, direction: randomly chosen from 12 angular directions 30° apart for each individual stimulus presentation interval, see polar plot inset). Scale bar = 100 μm (np: tectal neuropil, SPV: stratum periventriculare). b Average fluorescence modulations of all voxels in six anatomically identified zones during visual stimulation with moving bars (n = 8 larvae, color code: 1. dark blue = superficial contralateral neuropil, 2. blue = deep contralateral neuropil, 3. light blue = contralateral SPV, 4. yellow = ipsilateral SPV, 5. orange = deep ipsilateral neuropil, 6. red = superficial ipsilateral neuropil, dark gray shading indicates the 95% confidence intervals, light gray vertical bars indicate the stimulus interval). In addition to the expected stimulus-synchronized activity in the tectal hemisphere contralateral to the stimulated eye, visually evoked activity was also observed in the neuropil of the ipsilateral tectum. Moving bar directions for each stimulus presentation interval are indicated by black arrows above the traces with respect to a larva’s orientation as shown in the polar plot inset in a. Source data are provided as Source Data File. c Highly stimulus-correlated voxels (R2 > 0.4) were found in the tectal hemisphere contralateral to the stimulated eye, consistent with direct contralateral retinal input. However, stimulus-correlated voxels were also observed in the ipsilateral tectal hemisphere, which in this experiment does not receive any direct retinal input due to eye enucleation. Scale bar = 50 μm. Source data are provided as Source Data File. d The average density projection of voxels (calculated as the mean over the short axis of the curved rectangle in the left panel) that are highly correlated with a moving bar stimulus (R2 > 0.4, as in c shows an enrichment in the tectal hemisphere contralateral to the stimulated eye and in the deep ipsilateral neuropil. Anatomical regions were color-coded as in a and b (n = 8 larvae, gray shading indicates the 95% confidence interval, np: tectal neuropil, SPV: stratum periventriculare, ML: midline).
|
