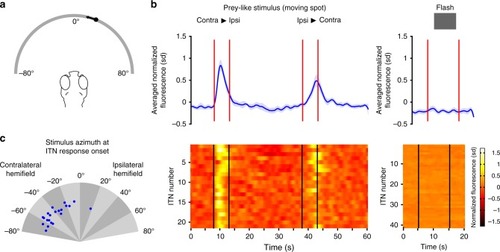
ITNs display visual sensory responses to prey-like moving target stimuli. a Schema of the virtual hunting assay. 5–6 dpf ITNGal4, UAS:GCaMP3 larvae were tethered in agarose with their eyes free to move. Small moving spots (size: 5°, speed: 30° s−1) moving horizontally from right to left or vice versa were projected on a curved screen covering ~160° of visual space. At the same time, a 2-photon microscope was used to record fluorescent calcium signals in ITNs in response to the visual stimuli as well as eye kinematics using an infrared imaging camera. b ITN cell bodies showed strong Ca-transient modulations in response to moving spots (stimulus intervals indicated by the red/black vertical lines, n = 21 ITNs from five larvae) whereas ITNs did not respond to flashes (n = 41 ITNs from three larvae). Traces show mean normalized fluorescence intensities with 95% confidence intervals. Source data are provided as Source Data File. c Azimuth of moving spots at the onset of the response of each ITN to visual prey-like stimuli. ITNs collectively respond to moving spots spanning almost the whole contralateral visual hemifield (n = 21 ITNs from five larvae). Source data are provided as Source Data File.
|
