- Title
-
Neural crest development: Insights from the zebrafish
- Authors
- Rocha, M., Singh, N., Ahsan, K., Beiriger, A., Prince, V.E.
- Source
- Full text @ Dev. Dyn.
|
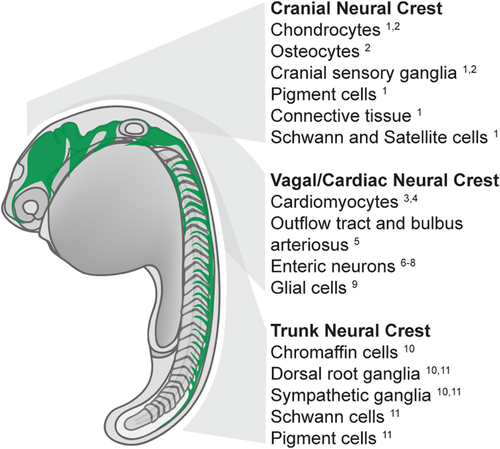
Zebrafish neural crest regionalization and derivatives. Schematic summarizing neural crest migration pathways (green) in the 22 hpf zebrafish embryo. Cell fates derived from specific anteroposterior levels are indicated. (1) Schilling and Kimmel11 (2) Kague et al.52 (3) Li et al.53 (4) Sato and Yost54 (5) Cavanaugh et al.55 (6) Elworthy et al.46 (7) Olden et al.56 (8) Shepherd et al.47 (9) Shepherd and Eisen57 (10) An et al.58 and (11) Raible et al.10 |
|
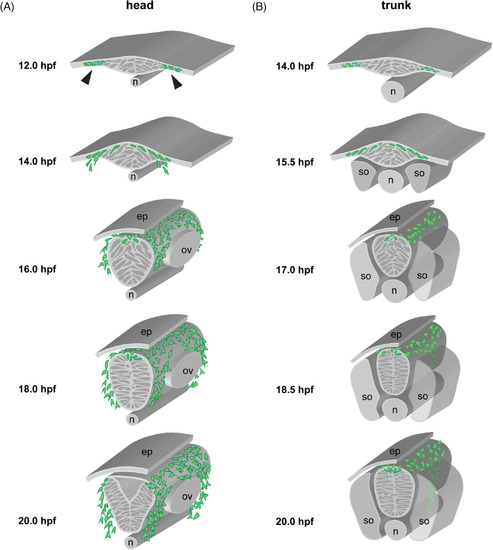
Zebrafish neurulation and neural crest migration pathways. A, Cranial neurulation and neural crest migration, schematized at the rhombomere (r)4‐6 level, showing neural crest cells (green) migrating anterior and posterior of the otic vesicle towards pharyngeal arch (PA)2 and PA3, respectively. Stages are indicated, with laterally segregated cells apparent at 12 hpf (arrowheads), convergence movements forming the neural keel by 14 hpf, a neural rod at 18 hpf (with a clear midline now established), and finally a neural tube at 20 hpf. Note that the anterior terminus of the notochord lies under r4 in the zebrafish. B, Trunk neurulation and neural crest migration, schematized at the somite 7/8 level, showing neural crest cells (green) migrating on the medial pathway adjacent to the center of each somite. Stages are indicated. n = notochord; ep = epidermis; ov = otic vesicle; s = somite |
|
A zebrafish‐specific neural crest GRN. This simplified gene regulatory network is built exclusively from zebrafish data; see text for details. Direct interactions are depicted with solid lines, whereas dashed lines show interactions inferred from loss‐of‐function studies |
|
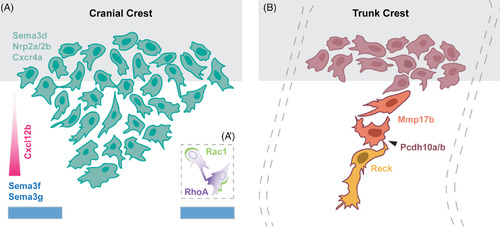
Models of neural crest migration. A, Schematic of molecular regulators of cranial neural crest migration. A stream of cranial NCCs migrates away from the neural tube (grey) avoiding repulsive Sema3f and Sema3g cues in the environment, shown in blue, and towards the chemokine Cxcl12b, shown in pink. These cells express Sema3d, as well as the receptors Nrp2a/2b and Cxcr4a. The inset (A') shows the molecular basis of CIL, during which Rac1 and RhoA activity become recruited to the trailing and leading end, respectively. B, Schematic of trunk neural crest cell migration, away from the neural tube (grey), depicting the leader (yellow), follower (orange), and premigratory (red) populations. Leader cells express Reck, whereas follower cells express Mmp17b. All trunk neural crest cells express Pcdh10a/b, which mediates cell–cell contacts (arrowhead). Segmental migration of trunk neural crest cells is restricted by adaxial cells; see text for details |


