
Fig. 5
- ID
- ZDB-FIG-200327-31
- Publication
- Rocha et al., 2019 - Neural crest development: Insights from the zebrafish
- Other Figures
- All Figure Page
- Back to All Figure Page
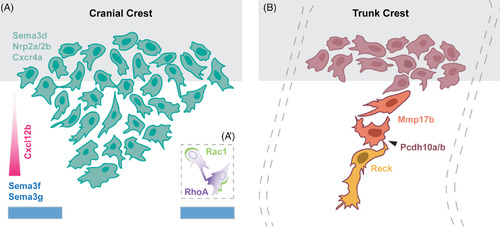
Models of neural crest migration. A, Schematic of molecular regulators of cranial neural crest migration. A stream of cranial NCCs migrates away from the neural tube (grey) avoiding repulsive Sema3f and Sema3g cues in the environment, shown in blue, and towards the chemokine Cxcl12b, shown in pink. These cells express Sema3d, as well as the receptors Nrp2a/2b and Cxcr4a. The inset (A') shows the molecular basis of CIL, during which Rac1 and RhoA activity become recruited to the trailing and leading end, respectively. B, Schematic of trunk neural crest cell migration, away from the neural tube (grey), depicting the leader (yellow), follower (orange), and premigratory (red) populations. Leader cells express Reck, whereas follower cells express Mmp17b. All trunk neural crest cells express Pcdh10a/b, which mediates cell–cell contacts (arrowhead). Segmental migration of trunk neural crest cells is restricted by adaxial cells; see text for details |