FIGURE SUMMARY
Title

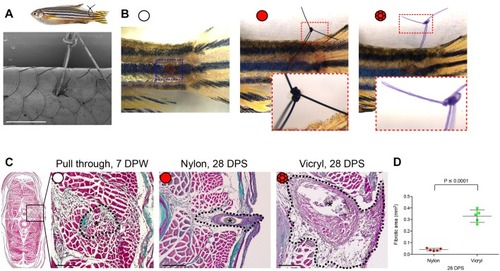
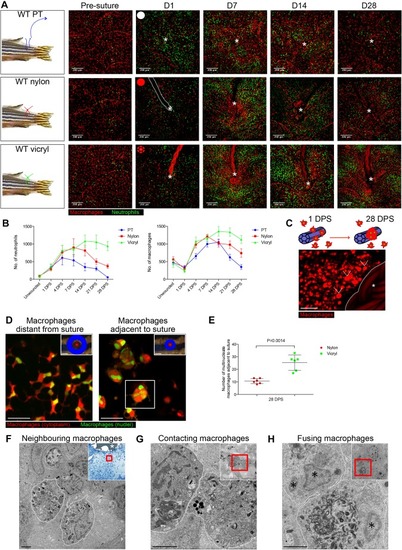
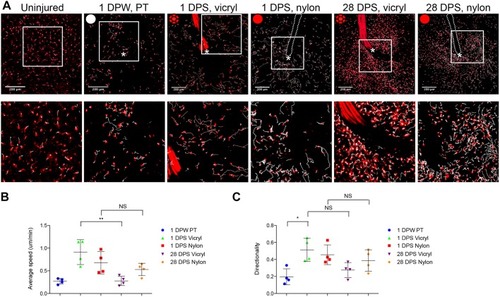
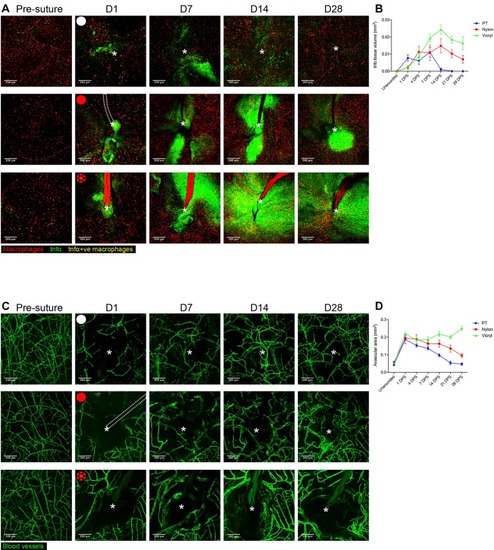
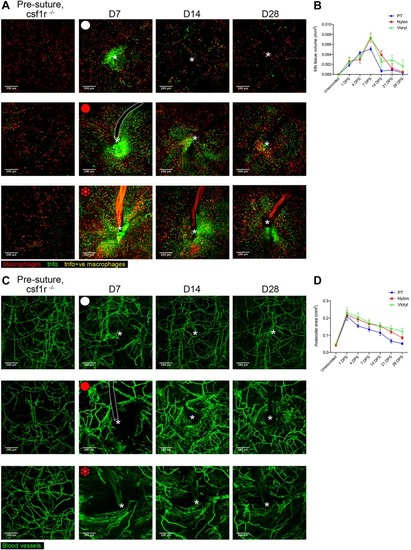
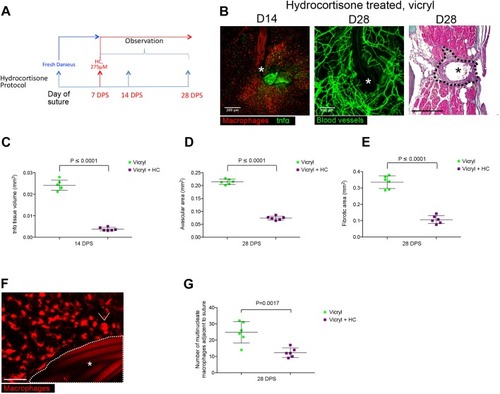
Live imaging the Foreign Body Response reveals how dampening inflammation reduces fibrosis

Authors
Gurevich, D.B., French, K.E., Collin, J.D., Cross, S.J., Martin, P.
Source
Full text @ J. Cell Sci.

Extent of foreign body fibrotic encapsulation is dependent on suture type. (A) Schematic illustration of the zebrafish suture model, with scanning electron micrograph showing a suture in place. n=6 independent fish. (B) Representative images of zebrafish following suture pull through (white circle), nylon suture (red circle) or vicryl suture (red braided circle), at 1 day post suturing (DPS) with insets to show suture detail. n=5 independent fish per condition. (C) Masson's Trichrome-stained transverse sections of pull through at 7 DPW, and nylon or vicryl sutured fish at 28 DPS, to indicate extent of fibrosis. Sutures are indicated with black asterisks; the zone of scarring and fibrotic encapsulation is indicated by black dotted line overlay. n=5 independent fish per condition. (D) Quantification of total area of fibrotic encapsulation, measured from images in C. Error bars in D indicate mean±s.d. Statistical significance is indicated, as determined by two-tailed t-test. Scale bars: 1 mm (A,B), 100 μm (C).

Magnitude of immune response and numbers of foreign body giant cells are greater for vicryl versus nylon sutures. (A) Schematic and representative images of Tg(mpx:GFP); Tg(mpeg:mCherry) double transgenic zebrafish immediately prior to and following suture pull through (PT; top row, white circle), or implantation of nylon (middle row, red circle) or vicryl (bottom row, red braided circle) sutures, at indicated time points. The area of wounding or implantation is marked by a white asterisk; dotted lines indicate nylon suture. n=6 independent fish per condition. (B) Quantification of neutrophil and macrophage numbers in the vicinity of wound/suture, measured from images in A. (C) Schematic of macrophage fusion observed in the vicinity of the suture, and representative image of Tg(mpeg:mCherry) transgenic adult zebrafish at 28 DPS, showing larger ‘fused’ macrophages, or FBGCs (arrowheads), adjacent to the vicryl suture (white asterisk) with more standard-size macrophages further from the suture. n=5 independent fish per condition. (D) Representative images of Tg(mpeg:mCherry); Tg(mpeg:nlsClover) double transgenic zebrafish at 28 DPS, showing that the larger macrophages adjacent to sutures (within 200 μm radius) are multinucleated (an exemplar such cell, indicated by the boxed area, is revisited in Fig. S2), compared to normal-sized, single-nucleated macrophages at more distal sites (adjacent and ‘distal to suture’ zones illustrated in blue). n=6 independent fish per condition. (E) Quantification of images from D, indicating the number of large, multinucleated macrophages adjacent to a wound/suture for nylon and vicryl sutures, at 28 DPS. Statistical significance is indicated, as determined by two-tailed t-test. (F–H) Representative electron micrographs showing three different stages of macrophage–macrophage interactions at 28 DPS: (F) nearby but not directly contacting macrophages (membranes indicated by dotted lines); (G) two adjacent macrophages coming into direct plasma membrane contact; (H) a membrane fusion of two macrophages. Insets are low magnification images with red box highlighting the area shown in the high magnification view. In F, the low magnification inset is a Methylene Blue-stained thick section with the suture indicated by a white asterisk. In H, macrophage nuclei are indicated by black asterisks. These panels are also presented without white lines to assist direct observation in Fig. S2C. n=4 independent fish. Error bars in B and D indicate mean±s.d. Scale bars: 200 μm (A, insets in D), 50 μm (C), 20 μm (main images in D), 2 μm (F–H).

Immune cell motility and directionality within suture-adjacent tissues are affected by implanted material. (A) Endpoints from 180 min long representative time lapse movies of Tg(mpeg:mCherry) transgenic adult zebrafish at the indicated time points of uninjured, post-pull through (PT, white circle) or suture implant (red and red braided circles for nylon and vicryl, respectively), showing the tracks of macrophages as they respond to the wound/suture. Tracks are generated by automated cell tracking software (see Materials and Methods) and are indicated by white lines; the area of wounding or implantation is marked by a white asterisk; the dotted lines indicates nylon suture; boxed areas shown in lower row. n=4 independent fish per condition, per tim epoint. (B) Quantification of mean±s.d. macrophage speed at 1 day and 28 days post implantation, averaged from tracking data, indicating how motility is suppressed at later time points, particularly with vicryl sutures. Statistical significance, as measured by one-way ANOVA, is P=0.0045. (C) Quantification of directionality of macrophages at 1 and 28 days post implantation, averaged from tracking data. Statistical significance, as measured by one-way ANOVA, is P=0.0078. *P≤0.05; **P≤0.001; NS, not significant. Scale bars: 200 μm.

Extent of tnfα expression and size of avascular zone are dependent on suture type. (A) Representative images of Tg(tnfα:GFP); Tg(mpeg:mCherry) double transgenic zebrafish immediately prior to and following suture pull through (PT; top row, white circle), or implantation of nylon (middle row, red circle) or vicryl suture (bottom row, red braided circle), at indicated time points, showing macrophages (red), pro-inflammatory macrophages (yellow) and stromal cells expressing tnfα in the vicinity of the wound/suture zone (green). The area of wounding or implantation is marked by a white asterisk; dotted lines indicate nylon suture. n=8 independent fish per condition. (B) Quantification of the mean±s.d. total inflammatory area surrounding the wound/suture, measured from images in A. (C) Representative images of Tg(fli:GFP) transgenic zebrafish immediately prior to and following suture pull through (top row, white circle), or implantation of nylon (middle row, red circle) or vicryl suture (bottom row, red braided circle), to reveal angiogenic response at the indicated timepoints. The area of wounding or implantation is marked by a white asterisk; the dotted lines indicate nylon suture. n=8 independent fish per condition. (D) Quantification of the mean±s.d.extent of avascular zone immediately adjacent to wound/suture, measured from images in C. Scale bars: 200 μm.

Genetic immunosuppression results in decreased TNFα expression and reduced avascular zone. (A) Representative images of csf1ra−/− Tg(tnfα:GFP); Tg(mpeg:mCherry) double transgenic adult zebrafish immediately prior to and following suture pull through (PT, top row, white circle), or implantation of nylon (middle row, red circle) or vicryl suture (bottom row, red braided circle), at indicated time points. The area of wounding or implantation is marked by a white asterisk; the dotted lines indicate nylon suture. n=6 independent fish per condition. (B) Quantification of the mean±s.d. altered inflammatory area surrounding the wound/suture, measured from images in A. (C) Representative images of Tg(fli:GFP) transgenic adult zebrafish immediately prior to and following suture pull through (top row, white circle), or implantation of nylon suture (middle row, red circle) or vicryl suture (bottom row, red braided circle), at indicated time points. The area of wounding or implantation is marked by a white asterisk; the dotted lines indicate nylon suture. n=6 independent fish per condition. (D) Quantification of mean±s.d. avascular zone immediately adjacent to wound/suture, measured from images in C. Scale bars: 200 μm.

Pharmacological anti-inflammatory intervention results in a reduced avascular zone, fewer foreign body giant cells and decreased fibrotic encapsulation. (A) Diagram showing hydrocortisone (HC) treatment protocol used to dampen inflammation during FBR (7–28 DPS). (B) Representative images of Tg(tnfα:GFP); Tg(mpeg:mCherry), Tg(fli:GFP) suture site and Masson's Trichrome-stained section of suture tissue at the indicated time points following vicryl suture implantation and treatment with hydrocortisone. The site of suture implantation is marked by an asterisk; the dotted line indicates the zone of scarring and fibrotic encapsulation. n=6 independent fish per condition. (C) Quantification of mean±s.d. total inflammatory area surrounding the wound/suture, measured from images as in B. Statistical significance, as measured by two-tailed t-test, is P≤0.0001. (D) Quantification of mean±s.d. total area of fibrotic encapsulation, measured from images as in B. Statistical significance, as measured by two-tailed t-test, is P≤0.0001. (E) Quantification of mean±s.d. avascular zone area immediately adjacent to wound/suture, measured from images as in B. (F) Representative image of Tg(mpeg:mCherry) transgenic fish at 28 DPS, showing considerably fewer FBGCs (arrowhead) adjacent to the vicryl suture (white asterisk) following hydrocortisone treatment. n=6 independent fish per condition. (G) Quantification of results from images from F, showing that average number of FBGCs adjacent to the vicryl suture (within 200 μm radius) decreases following hydrocortisone treatment. Statistical significance, as measured by two-tailed t-test, is P=0.0008. Scale bars: 200 μm (B), 50 μm (F).

Acknowledgments
This image is the copyrighted work of the attributed author or publisher, and ZFIN has permission only to display this image to its users. Additional permissions should be obtained from the applicable author or publisher of the image. Full text @ J. Cell Sci.