IMAGE

Fig. 2.

ID
ZDB-IMAGE-191230-507
Source
Figures for Gurevich et al., 2019
Image
Figure Caption

Fig. 2.

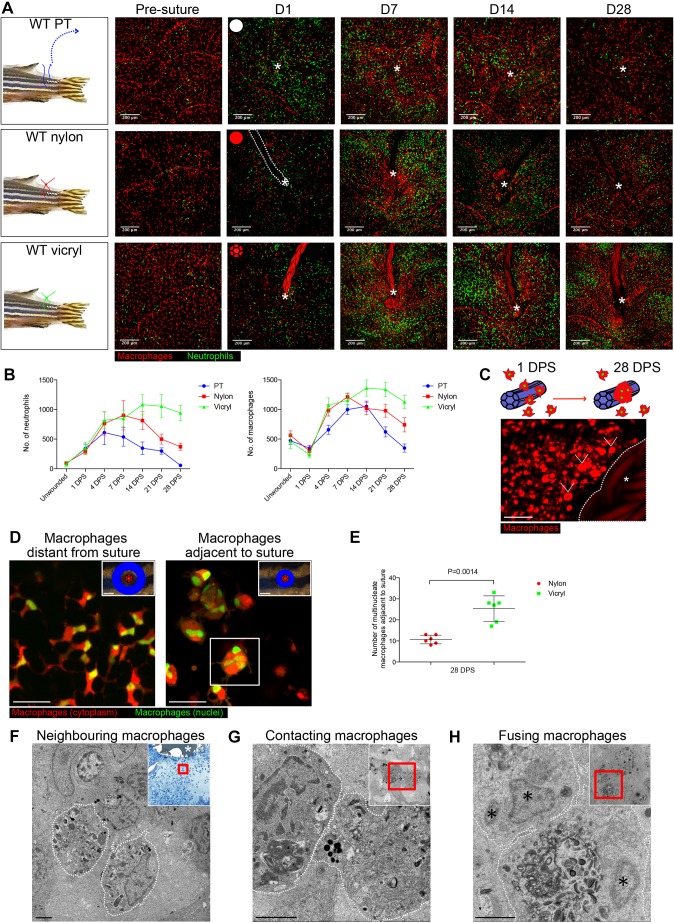
Magnitude of immune response and numbers of foreign body giant cells are greater for vicryl versus nylon sutures. (A) Schematic and representative images of Tg(mpx:GFP); Tg(mpeg:mCherry) double transgenic zebrafish immediately prior to and following suture pull through (PT; top row, white circle), or implantation of nylon (middle row, red circle) or vicryl (bottom row, red braided circle) sutures, at indicated time points. The area of wounding or implantation is marked by a white asterisk; dotted lines indicate nylon suture. n=6 independent fish per condition. (B) Quantification of neutrophil and macrophage numbers in the vicinity of wound/suture, measured from images in A. (C) Schematic of macrophage fusion observed in the vicinity of the suture, and representative image of Tg(mpeg:mCherry) transgenic adult zebrafish at 28 DPS, showing larger ‘fused’ macrophages, or FBGCs (arrowheads), adjacent to the vicryl suture (white asterisk) with more standard-size macrophages further from the suture. n=5 independent fish per condition. (D) Representative images of Tg(mpeg:mCherry); Tg(mpeg:nlsClover) double transgenic zebrafish at 28 DPS, showing that the larger macrophages adjacent to sutures (within 200 μm radius) are multinucleated (an exemplar such cell, indicated by the boxed area, is revisited in Fig. S2), compared to normal-sized, single-nucleated macrophages at more distal sites (adjacent and ‘distal to suture’ zones illustrated in blue). n=6 independent fish per condition. (E) Quantification of images from D, indicating the number of large, multinucleated macrophages adjacent to a wound/suture for nylon and vicryl sutures, at 28 DPS. Statistical significance is indicated, as determined by two-tailed t-test. (F–H) Representative electron micrographs showing three different stages of macrophage–macrophage interactions at 28 DPS: (F) nearby but not directly contacting macrophages (membranes indicated by dotted lines); (G) two adjacent macrophages coming into direct plasma membrane contact; (H) a membrane fusion of two macrophages. Insets are low magnification images with red box highlighting the area shown in the high magnification view. In F, the low magnification inset is a Methylene Blue-stained thick section with the suture indicated by a white asterisk. In H, macrophage nuclei are indicated by black asterisks. These panels are also presented without white lines to assist direct observation in Fig. S2C. n=4 independent fish. Error bars in B and D indicate mean±s.d. Scale bars: 200 μm (A, insets in D), 50 μm (C), 20 μm (main images in D), 2 μm (F–H).

Acknowledgments
This image is the copyrighted work of the attributed author or publisher, and ZFIN has permission only to display this image to its users. Additional permissions should be obtained from the applicable author or publisher of the image. Full text @ J. Cell Sci.