- Title
-
Hoxa2 selectively enhances Meis binding to change a branchial arch ground state
- Authors
- Amin, S., Donaldson, I.J., Zannino, D.A., Hensman, J., Rattray, M., Losa, M., Spitz, F., Ladam, F., Sagerström, C., Bobola, N.
- Source
- Full text @ Dev. Cell
|
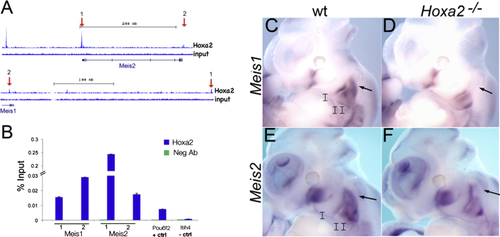
Hoxa2 Activates Meis1 and Meis2 in the IIBA (A) ChIP-seq-binding profile of Hoxa2 at Meis1 and Meis2 genes in E11.5 IIBA. Input tracks represent control genomic DNA. Arrows highlight the binding regions tested by ChIP qPCR in (B). (B) Hoxa2 binding to Meis1 and Meis2 by ChIP qPCR. Enrichment of each region following immunoprecipitation with Hoxa2 and IgG negative control antibody (Neg Ab) is calculated as percentage input; 1 and 2 indicate the corresponding peaks in (A). Pou6f2 is a positive control and Itih4 is a negative control (unbound region). Values represent the average of duplicate samples, and error bars indicate the SEM. (C–F) Whole-mount ISH on E11.5 wild-type (C and E) and Hoxa2 mutant (D and F) embryos, using Meis1 and Meis2 probes. Arrows indicate the proximal domain of expression in the IIBA. See also Figure S1. |
|
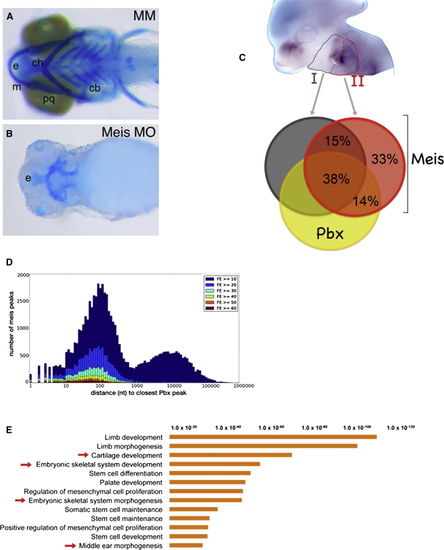
Meis TFs Are Required to Form the Branchial Arch-Derived Skeleton (A and B) Ventral view of zebrafish larval (6 days postfertilization) control (mismatched morpholino, MM) (A) and Meis-morpholino-injected embryos (B) head skeleton. The IIBA-derived skeleton (ceratohyal) is labeled by ch. (C) Craniofacial region of a E11.5 mouse embryo hybridized with Meis1 antisense probe; IBA (gray) and IIBA (red) are outlined. Overlap of Meis summit regions (200 nt, overlap at least 1 nt) in the IIBA (red), with Meis summit regions in the IBA (dark gray) and Pbx summit regions in the IIBA (yellow). (D) Distance of Meis peaks relative to Pbx peaks. Meis peaks (IIBA) are binned according to the distance to the nearest Pbx peak and labeled according to FE (high FE, dark red bars; low FE, dark blue bars). (E) Top overrepresented functional categories associated to common Meis/Pbx-bound regions in the branchial arches. The length of the bars corresponds to the binomial raw (uncorrected) p values (x axis values). Cb, ceratobranchials; ch, ceratohyals; e, ethmoid plate; m, Meckel cartilage; and pq, palatoquadrate. See also Figure S2. |
|
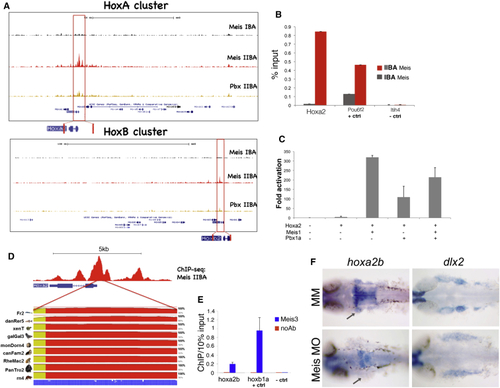
Meis Regulates Hoxa2 Expression (A) Meis and Pbx ChIP-seq-binding profiles at the HoxA and HoxB clusters in the IBA and IIBA of E11.5 embryos. Red boxes highlight Meis binding at Hoxa2 and Hoxb2 in IIBA chromatin. (B) Meis occupancy at Hoxa2 promoter in IBA and IIBA chromatin (mouse) by ChIP qPCR. Pou6f2 is a positive control and Itih4 is a negative control (unbound region). Values represent the average of duplicate samples, and error bars indicate the SEM. (C) Luciferase activity driven by Hoxa2 proximal promoter in HEK293T cells alone or in combination with Hoxa2, Meis, and Pbx expression vectors. Values represent fold activation over basal promoter activity, and are presented as the average of at least two independent experiments, each performed in triplicate. Error bars represent the SEM. (D) Sequence conservation of the Hoxa2 proximal promoter in vertebrates, generated by the ECR Browser (Ovcharenko et al., 2004). (E) Meis binding at hoxa2b promoter in zebrafish embryos by ChIP qPCR. Hoxb1a is a positive control; the negative control is a genomic region 10 kb upstream of the hoxba cluster. Enrichment of hoxa2b and hoxb1a is significantly higher compared to the negative control regions (p < 0.005). Values represent the average of three independent experiments, and error bars indicate the SEM. (F) Whole-mount ISH on control MM and Meis-morpholino-injected embryos, using hoxa2b and dlx2 probes. Hoxa2b is downregulated in the second arch (gray arrows); dlx2 labels the developing branchial arches. |
|
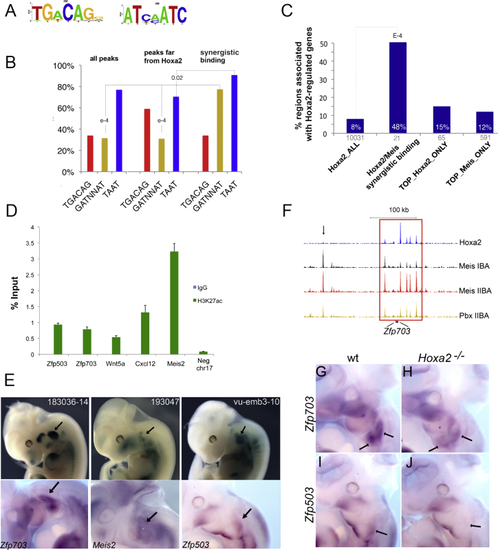
Synergistic Binding Is Sequence Based and Associated with Hoxa2-Activated Genes (A) Sequence logo of the top motifs identified using de novo motif discovery. (B) Distribution of motifs in Meis peaks (entire ChIP-seq), top Meis peaks far from Hoxa2, and Meis peaks corresponding to Hoxa2-Meis synergistic binding (200 nt summit regions). Red, yellow, and blue columns represent the occurrence of TGACAG, GATNNAT, and TAAT, respectively. The occurrence of GATNNAT is significantly higher in synergistic binding events relative to Meis ChIP-seq (p values shown on the tops of columns). (C) Percentage of Hoxa2-bound regions associated to a Hoxa2-regulated gene in the entire Hoxa2 ChIP-seq (Hoxa2_ALL), Hoxa2/Meis synergistic binding, top 1% Hoxa2 peaks (TOP_Hoxa2_ONLY), and top 1% Meis peaks (TOP_Meis_ONLY). For each category, the corresponding number of regions is indicated on the x axis. (D) High enrichment of the histone mark H3K27Ac on Hoxa2/Meis synergistic binding regions in IIBA chromatin, relative to a negative control region using ChIP qPCR. Data are presented as the average of two independent experiments in duplicate and error bars indicate the SEM. (E) Integration of a lacZ reporter gene in genomic regions containing Hoxa2/Meis synergistic binding events. The expression of the reporter (top) and the expression of Hoxa2-regulated genes associated to the integration sites (bottom) are shown. (F) ChIP-seq tracks corresponding to the genomic region containing Zfp703. Meis binding in the IIBA overlapping a Hoxa2 peak (enclosed by the red rectangle) is enhanced relative to Meis binding in the IBA. Black arrow shows similar binding of Meis in the IBA and IIBA in regions not bound by Hoxa2. (G–J) Whole-mount ISH on E11.5 wild-type (G and I) and Hoxa2 mutant (H and J) embryos, using Zfp703 (G and H) and Zfp503 (I and J) probes. Both Zfp703 and Zfp503 are specifically downregulated in the IIBA (black arrows) of Hoxa2 mutant embryos. See also Figure S5. |
Reprinted from Developmental Cell, 32, Amin, S., Donaldson, I.J., Zannino, D.A., Hensman, J., Rattray, M., Losa, M., Spitz, F., Ladam, F., Sagerström, C., Bobola, N., Hoxa2 selectively enhances Meis binding to change a branchial arch ground state, 265-77, Copyright (2015) with permission from Elsevier. Full text @ Dev. Cell


