
- Title
-
Brain-wide cellular resolution imaging of Cre transgenic zebrafish lines for functional circuit-mapping
- Authors
- Tabor, K.M., Marquart, G.D., Hurt, C., Smith, T.S., Geoca, A.K., Bhandiwad, A.A., Subedi, A., Sinclair, J.L., Rose, H.M., Polys, N.F., Burgess, H.A.
- Source
- Full text @ Elife
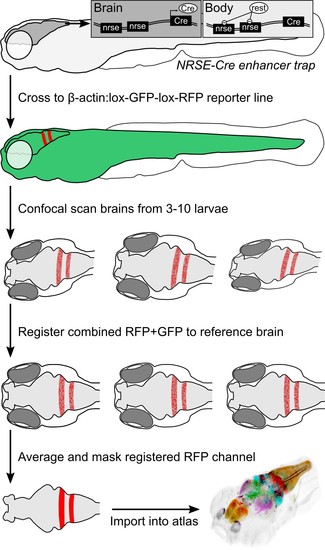
Procedure for imaging and co-registering new Cre lines.Inset schematics: neuronal-restrictive silencing element (NRSE) sites in the enhancer trap construct are targets for the REST protein, which suppresses Cre expression outside the brain. |
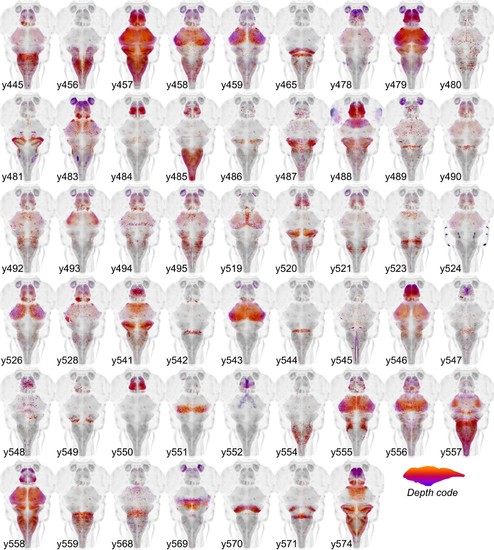
Cre enhancer trap lines.Horizontal maximum projection of 52 new Cre enhancer trap lines, with color indicating depth along the dorsal-ventral dimension (huC counter-label, grey). |
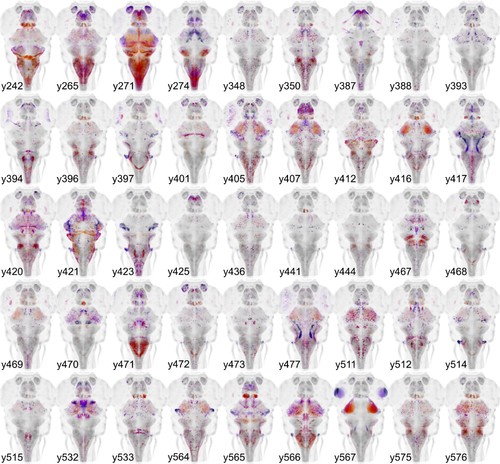
Gal4 enhancer trap lines.Horizontal maximum projection of 45 new Gal4 enhancer trap lines (depth coded; huC counter-label, grey). |
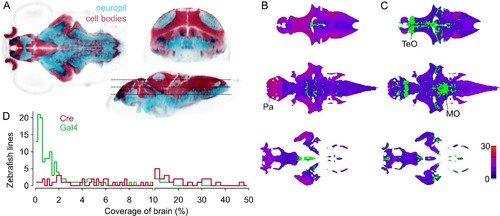
Spatial coverage of Cre and Gal4 enhancer trap lines.(A) Horizontal (left), coronal (top right), sagittal (bottom right) sections showing huC:nls-mCar (cell bodies, red) and huC:Gal4,UAS:syp-RFP (neuropil, cyan) from ZBB (huC counter-label, gray), illustrating the separation of cell bodies and neuropil in six dpf brains. (B–C) Horizontal sections (at the levels indicated in A) of heat-maps showing the number of et-Cre (B) and et-Gal4 (C) lines that label each voxel within the cellular area of the brain (scale bar, right). Voxels that lack coverage indicated in green. Coverage for Cre lines is highest in the pallium (Pa). Gal4 lines conspicuously lack coverage in the anterior optic tectum (TeO) and in a medial zone of the medulla oblongata (MO). (D) Histogram of the cellular-region coverage for et-Cre (red) and et-Gal4 (green) lines. |
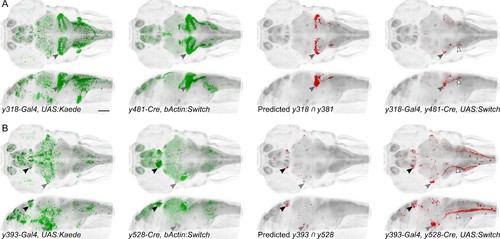
Spatially restricted reporter expression in Gal4/Cre intersectional domains.Maximum projections for et-Gal4 and et-Cre lines predicted to show co-expression in small domains of neurons, and of the resulting pattern of expression in a triple transgenic et-Gal4, et-Cre, UAS:KillSwitch larva. Scale bar 100 µm. (A) Horizontal (top) and sagittal (bottom) maximum projections for (left to right): y318-Gal4 expression, y481-Cre expression, predicted reporter distribution in cells that co-express y318 and y481,actual RFP expression in an individual y318, y481, UAS:KillSwitch larva. Closed arrowhead indicates the cerebellar eminentia granularis (Eg), which is labeled in both lines and the intersect. Open arrowhead indicates descending fiber tract from Eg neurons. (B) As for (A) with y393-Gal4 and y528-Cre lines. Closed arrowheads indicate the lateral habenula (black) and trigeminal ganglion (grey). Open arrowhead indicates central projections from the trigeminal ganglion. |
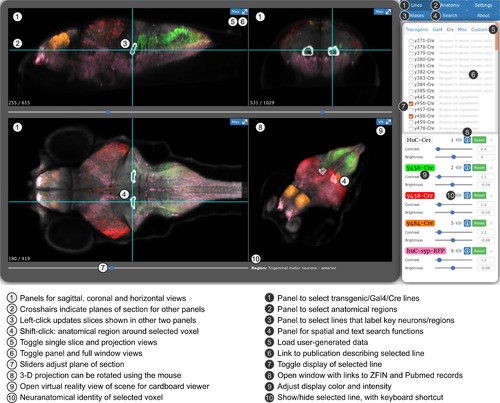
Web-browser based edition of the Zebrafish Brain Browser with key functions annotated.Panel size can be adjusted to best fit screen dimensions with the Settings menu. |